NOTE: Gray indicates insufficient data or a suppressed estimate.
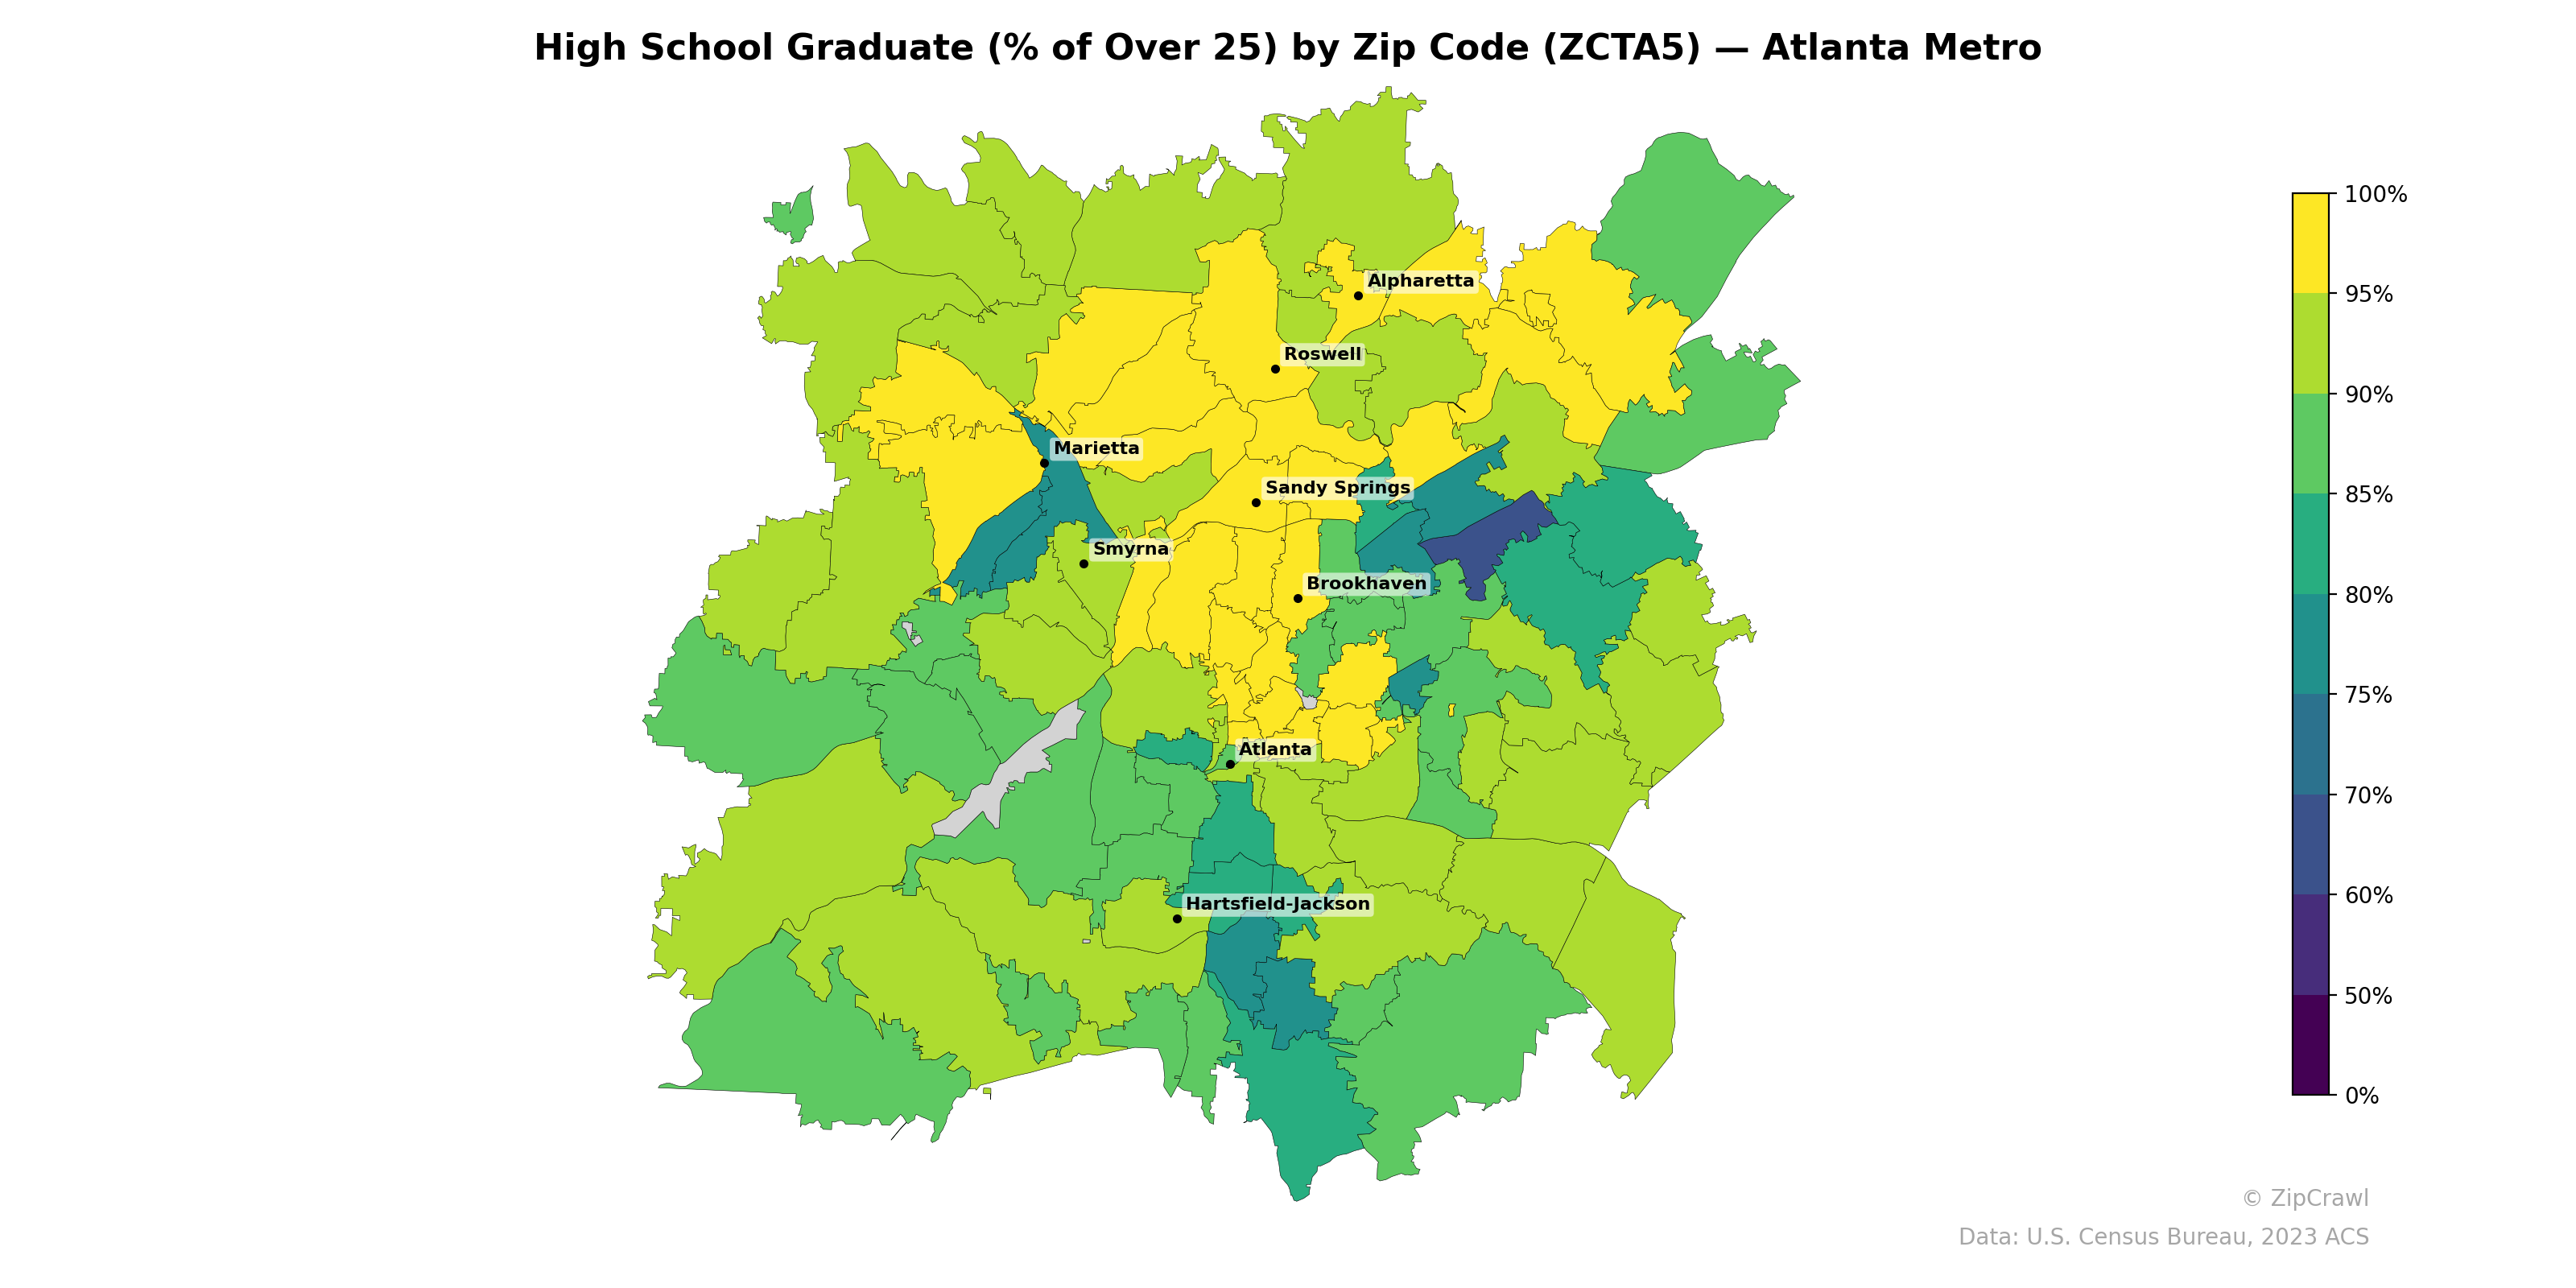
High school graduation rates across the Atlanta metro exhibit a clear north-south gradient, with zip codes north of I-285—particularly around Alpharetta, Roswell, and Sandy Springs—consistently reaching 90–100%, while areas south of Hartsfield-Jackson and in the southwestern periphery fall notably lower, often into the 70–80% range. A few pockets of markedly lower attainment (below 70%) appear in central zip codes near downtown Atlanta and in parts of Marietta, contrasting sharply with adjacent affluent areas. The eastern fringe of the metro also shows moderate depression in graduation rates compared to the predominantly yellow-green northern suburbs, suggesting persistent socioeconomic divides along both racial and geographic lines.
Data: U.S. Census Bureau, 2023 ACS
Explore
- Housing Vacancy Rate by Zip Code (ZCTA5) — New York Metro
- Population Non-Hispanic American Indian % by Zip Code (ZCTA5) — Atlanta Metro
- Population Non-Hispanic Asian % by Zip Code (ZCTA5) — Washington D.C. Metro
- Population Non-Hispanic Black % by Zip Code (ZCTA5) — Atlanta Metro
- % of Population on Food Stamps or SNAP (Last 12 Months), by Zip Code (ZCTA5) — Washington D.C. Metro
- U.S. Citizens (% of Population Over 18) by Zip Code (ZCTA5) — Atlanta Metro
- Median Age by Zip Code (ZCTA5) — Atlanta Metro
- Population Hispanic % by Zip Code (ZCTA5) — Atlanta Metro
- Population Non-Hispanic White % by Zip Code (ZCTA5) — Atlanta Metro
- Household Median Income by Zip Code (ZCTA5) — Atlanta Metro
- Household Average Size by Zip Code (ZCTA5) — Idaho
- Population Non-Hispanic White % by County
- % of Population without Health Insurance, by Zip Code (ZCTA5) — New York Metro
- Population Non-Hispanic Asian % by Zip Code (ZCTA5) — New York Metro
- Household Average Size by Zip Code (ZCTA5) — New York Metro
- Housing Owner-Occupied Median Value ($), by Zip Code (ZCTA5) — New York Metro
- % of Households with Broadband Internet, by Zip Code (ZCTA5) — New York Metro
- Housing Median Monthly Rent ($), by Zip Code (ZCTA5) — New York Metro
- Housing % of Units Built Since 2010, by Zip Code (ZCTA5) — New York Metro
- Married Couple (% of all Households) by Zip Code (ZCTA5) — New York Metro
- Housing Vacancy Rate by Zip Code (ZCTA5) — North Carolina
- Household Average Size by Zip Code (ZCTA5) — North Carolina
- Population Non-Hispanic Asian % by Zip Code (ZCTA5) — North Carolina
- % of Population without Health Insurance, by Zip Code (ZCTA5) — North Carolina
- % of Households with Broadband Internet, by Zip Code (ZCTA5) — North Carolina
- Housing Owner-Occupied % of Units, by Zip Code (ZCTA5) — North Carolina
- Housing Median Monthly Rent ($), by Zip Code (ZCTA5) — North Carolina
- Housing % of Units Built Since 2010, by Zip Code (ZCTA5) — North Carolina
- Married Couple (% of all Households) by Zip Code (ZCTA5) — North Carolina
- Population Non-Hispanic American Indian % by Zip Code (ZCTA5) — North Carolina
- High School Graduate (% of Over 25) by Zip Code (ZCTA5) — Portland Metro
- High School Graduate (% of Over 25) by Zip Code (ZCTA5) — Austin Metro
- High School Graduate (% of Over 25) by Zip Code (ZCTA5) — Orlando Metro
- High School Graduate (% of Over 25) by Zip Code (ZCTA5) — Miami Metro
- High School Graduate (% of Over 25) by Zip Code (ZCTA5) — Denver Metro
- High School Graduate (% of Over 25) by Zip Code (ZCTA5) — Boston Metro
- High School Graduate (% of Over 25) by Zip Code (ZCTA5) — Detroit Metro
- High School Graduate (% of Over 25) by Zip Code (ZCTA5) — Tampa Metro
- High School Graduate (% of Over 25) by Zip Code (ZCTA5) — San Antonio Metro
- High School Graduate (% of Over 25) by Zip Code (ZCTA5) — Dallas Metro