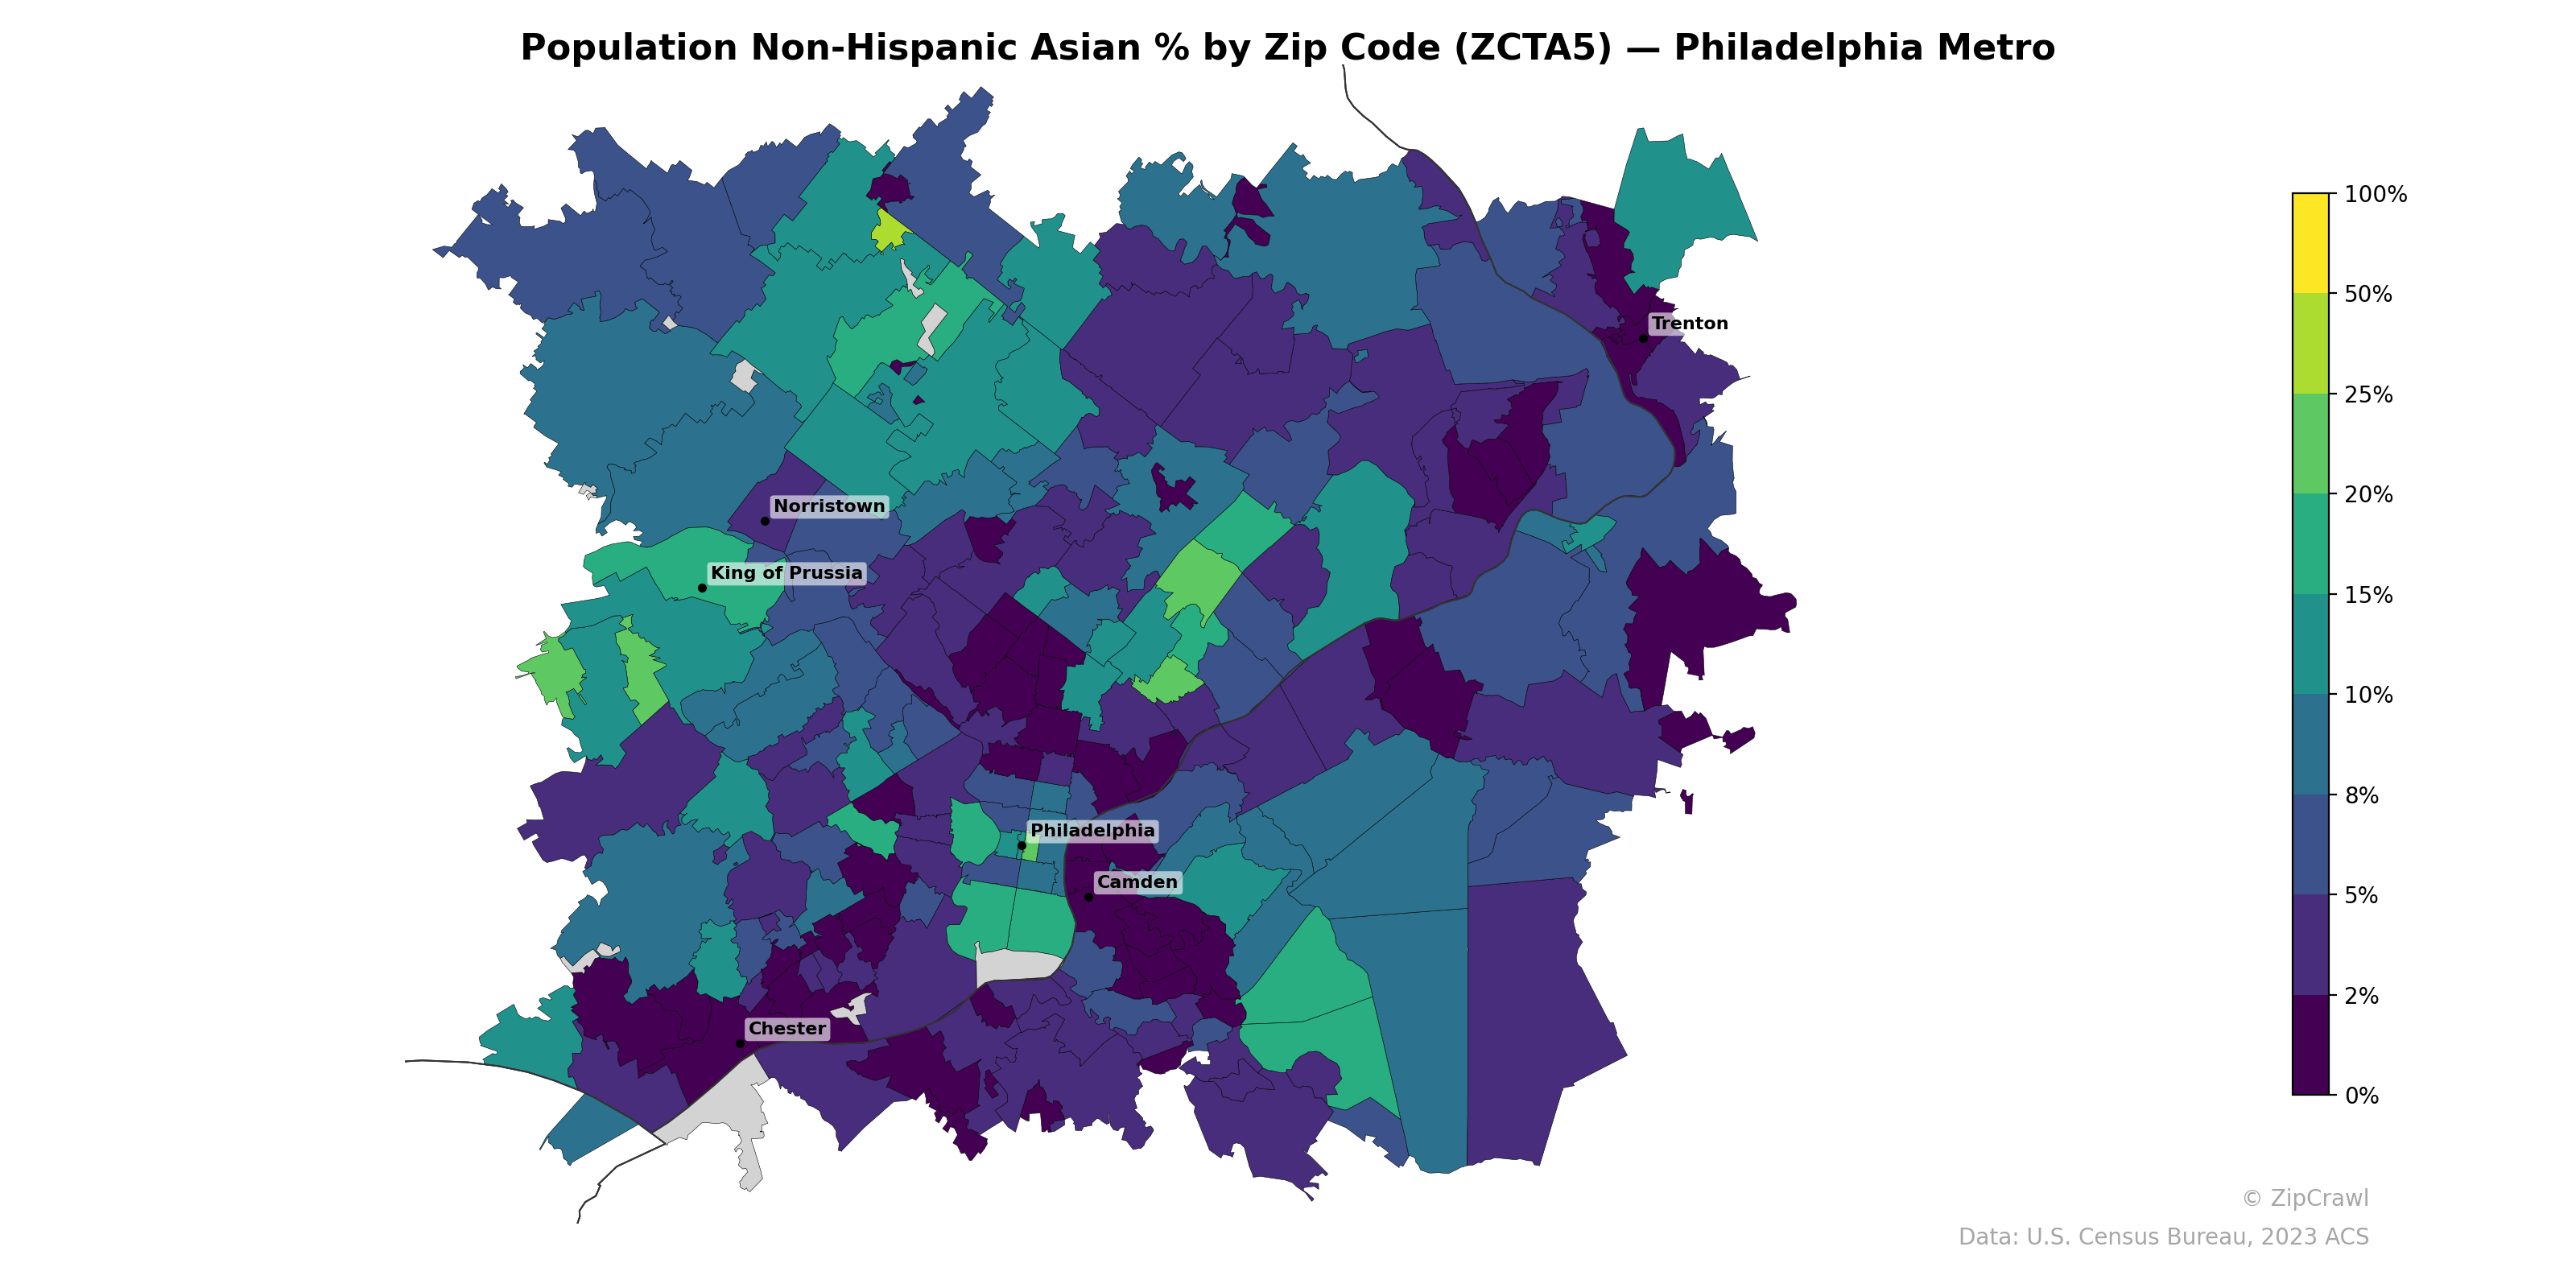
NOTE: Gray indicates insufficient data or a suppressed estimate.
The highest concentrations of Non-Hispanic Asian residents cluster in the northwestern suburbs around the Montgomery County corridor near Norristown and King of Prussia, where several zip codes exceed 15–25%, with one area north of Norristown reaching near 50% or above. A secondary elevated cluster appears in select zip codes east of Philadelphia extending into New Jersey, contrasting sharply with very low percentages (under 2%) in urban core areas of Philadelphia, Camden, Chester, and Trenton, which tend to have predominantly non-Asian minority populations. The western and southwestern suburban fringe also shows moderately elevated Asian population shares in the 8–15% range, suggesting a broad suburban arc of Asian settlement distinct from the lower-density urban centers.
Data: U.S. Census Bureau, 2023 ACS
Explore
- U.S. Citizens (% of Population Over 18) by Zip Code (ZCTA5) — Los Angeles Metro
- Population Non-Hispanic Black % by Zip Code (ZCTA5) — Phoenix Metro
- U.S. Citizens (% of Population Over 18) by Zip Code (ZCTA5) — Phoenix Metro
- % of Population on Food Stamps or SNAP (Last 12 Months), by Zip Code (ZCTA5) — Philadelphia Metro
- Population Non-Hispanic American Indian % by Zip Code (ZCTA5) — Phoenix Metro
- Population Non-Hispanic White % by Zip Code (ZCTA5) — Phoenix Metro
- Population Hispanic % by Zip Code (ZCTA5) — Phoenix Metro
- Household Median Income by Zip Code (ZCTA5) — Phoenix Metro
- Median Age by Zip Code (ZCTA5) — Phoenix Metro
- High School Graduate (% of Over 25) by Zip Code (ZCTA5) — Phoenix Metro
- Population Non-Hispanic American Indian % by Zip Code (ZCTA5) — Hawaii
- Population Hispanic % by County
- High School Graduate (% of Over 25) by Zip Code (ZCTA5) — Los Angeles Metro
- Population Non-Hispanic American Indian % by Zip Code (ZCTA5) — Los Angeles Metro
- Median Age by Zip Code (ZCTA5) — Los Angeles Metro
- Population Hispanic % by Zip Code (ZCTA5) — Los Angeles Metro
- % of Population on Food Stamps or SNAP (Last 12 Months), by County
- Population Non-Hispanic Black % by Zip Code (ZCTA5) — Los Angeles Metro
- % of Population on Food Stamps or SNAP (Last 12 Months), by Zip Code (ZCTA5) — New York Metro
- Population Non-Hispanic White % by Zip Code (ZCTA5) — Los Angeles Metro
- Household Median Income by Zip Code (ZCTA5) — Los Angeles Metro
- Housing Median Monthly Rent ($), by Zip Code (ZCTA5) — Virginia
- Housing Owner-Occupied % of Units, by Zip Code (ZCTA5) — Virginia
- Housing % of Units Built Since 2010, by Zip Code (ZCTA5) — Virginia
- Population Non-Hispanic American Indian % by Zip Code (ZCTA5) — Virginia
- Population Non-Hispanic Black % by Zip Code (ZCTA5) — Virginia
- % of Households with Broadband Internet, by Zip Code (ZCTA5) — Virginia
- % of Population without Health Insurance, by Zip Code (ZCTA5) — Virginia
- Housing Owner-Occupied Median Value ($), by Zip Code (ZCTA5) — Virginia
- High School Graduate (% of Over 25) by Zip Code (ZCTA5) — Virginia
- Population Non-Hispanic Asian % by Zip Code (ZCTA5) — Phoenix Metro
- Population Non-Hispanic Asian % by Zip Code (ZCTA5) — Boston Metro
- Population Non-Hispanic Asian % by Zip Code (ZCTA5) — Miami Metro
- Population Non-Hispanic Asian % by Zip Code (ZCTA5) — Houston Metro
- Population Non-Hispanic Asian % by Zip Code (ZCTA5) — Austin Metro
- Population Non-Hispanic Asian % by Zip Code (ZCTA5) — Detroit Metro
- Population Non-Hispanic Asian % by Zip Code (ZCTA5) — Tampa Metro
- Population Non-Hispanic Asian % by Zip Code (ZCTA5) — Chicago Metro
- Population Non-Hispanic Asian % by Zip Code (ZCTA5) — Atlanta Metro
- Population Non-Hispanic Asian % by Zip Code (ZCTA5) — Dallas Metro