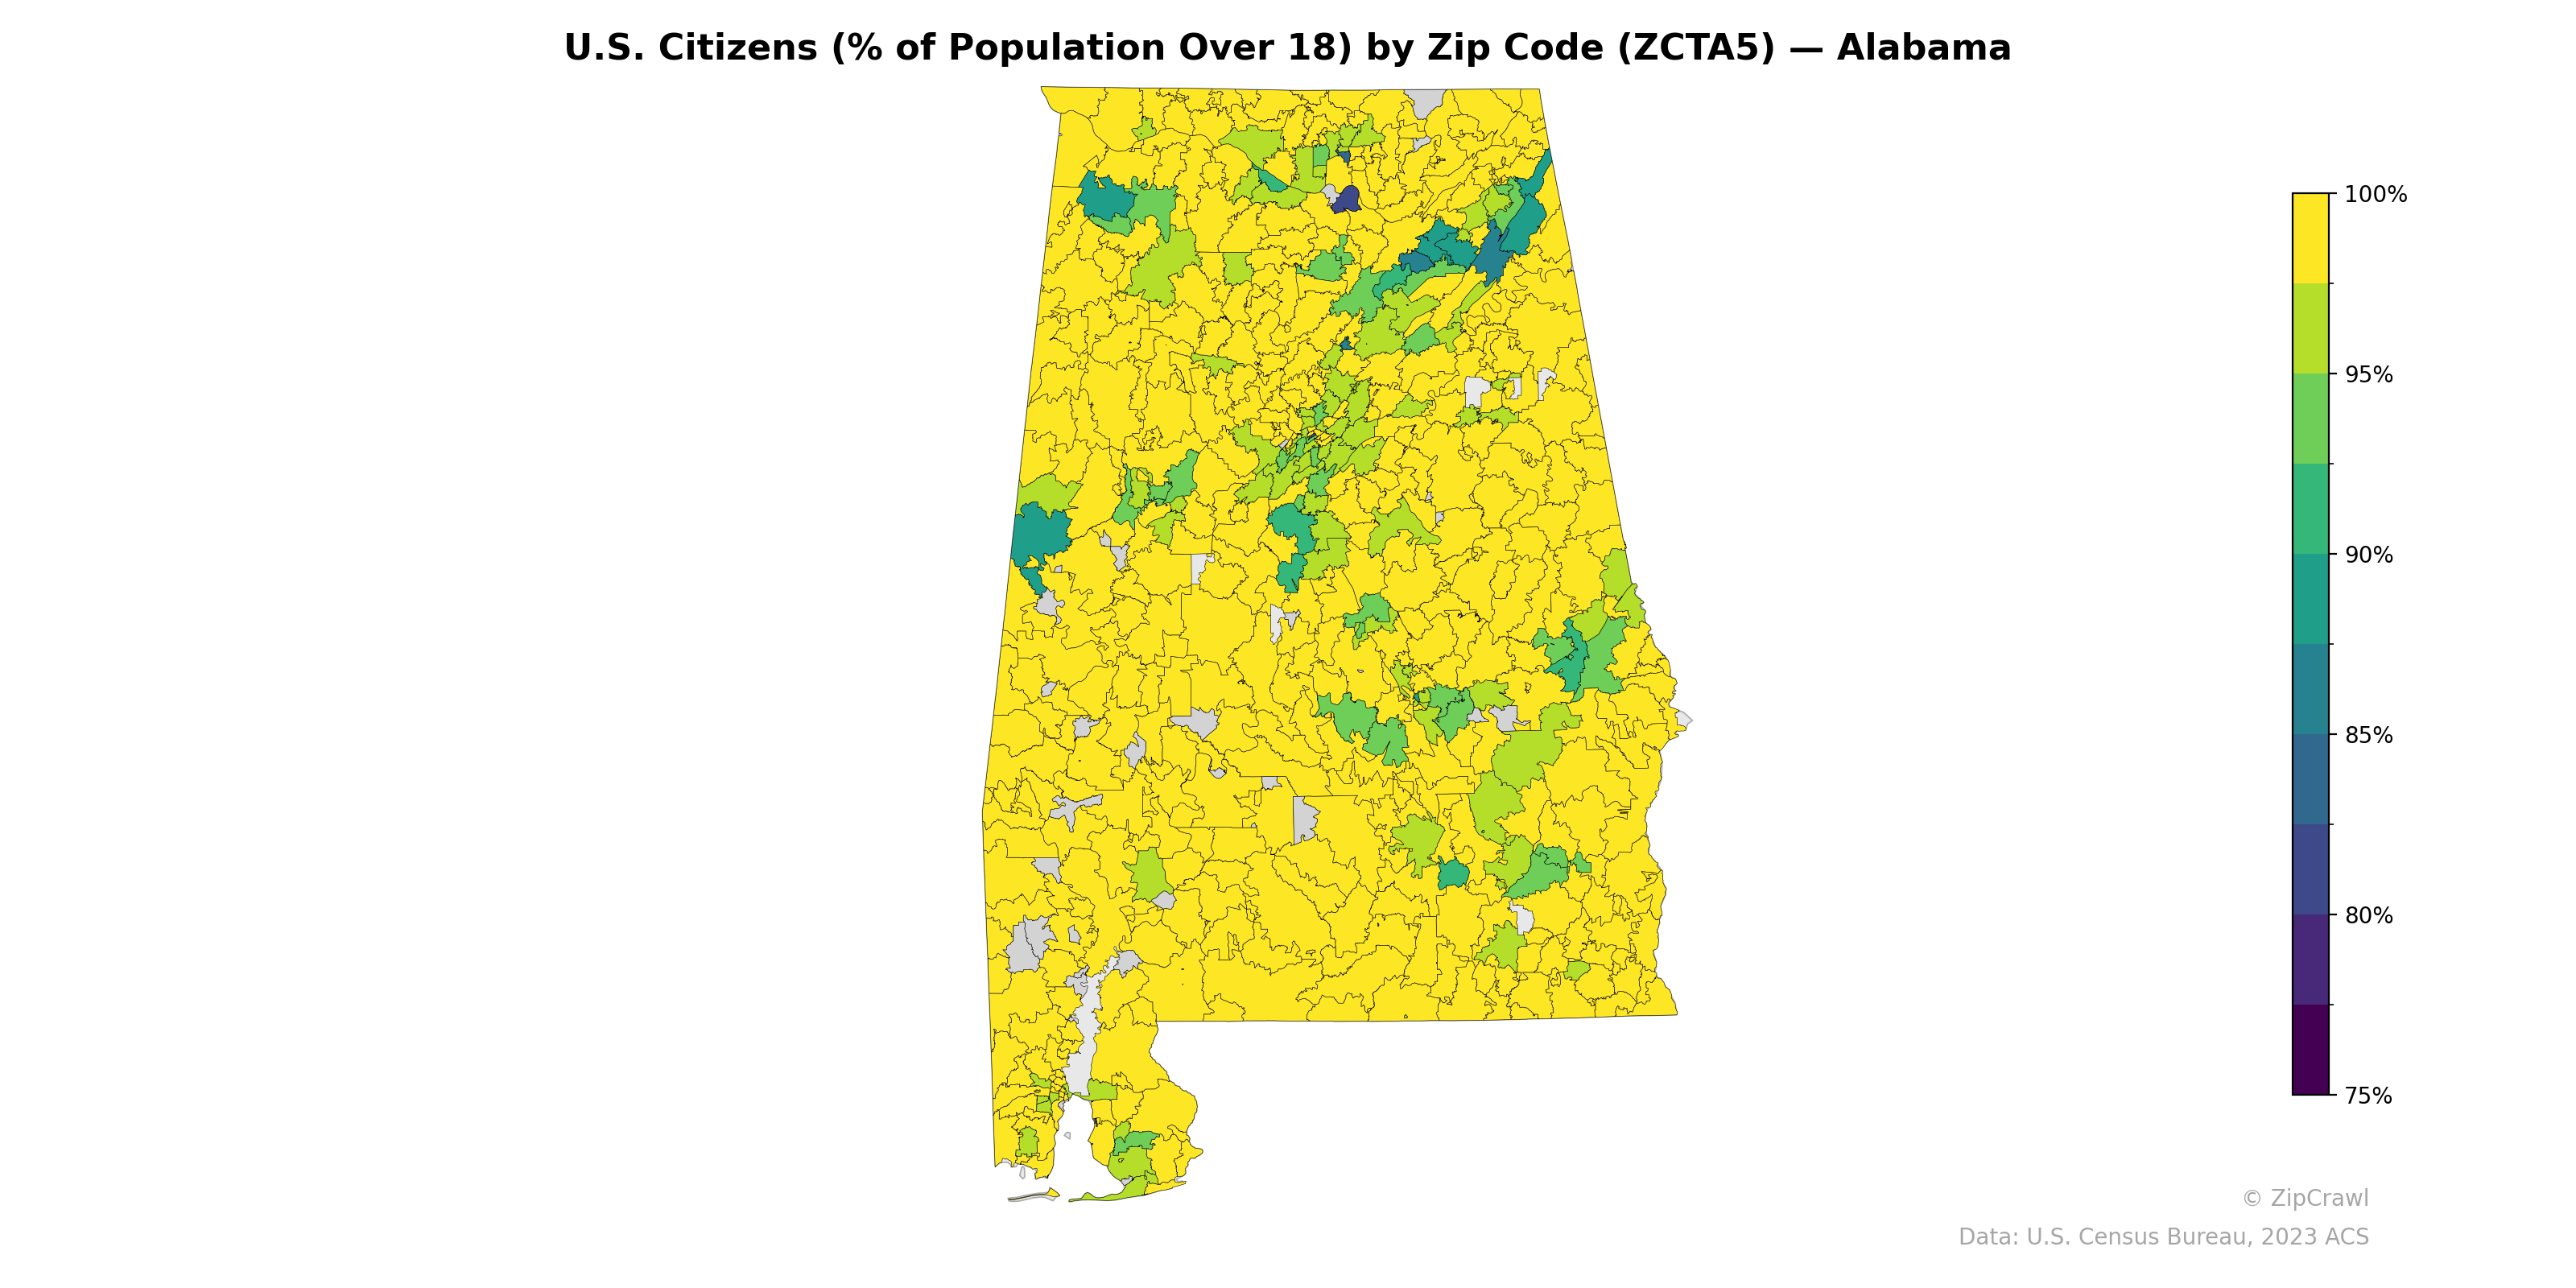
NOTE: Gray indicates insufficient data or a suppressed estimate.
The vast majority of Alabama zip codes report U.S. citizenship rates above 95% among the adult population, with near-universal citizenship (99–100%) predominating across rural areas in the southern and western portions of the state. Notable clusters of lower citizenship rates (85–92%) appear in the northern region around Huntsville and the Tennessee Valley, as well as scattered zip codes in the Birmingham metro area and parts of the central-southeast corridor, likely reflecting concentrations of immigrant populations near major employment centers. A handful of zip codes in the far north dip below 85%, representing the lowest citizenship percentages in the state and suggesting localized non-citizen communities tied to specific industries or university populations.
Data: U.S. Census Bureau, 2023 ACS
Explore
- Housing Owner-Occupied Median Value ($), by Zip Code (ZCTA5) — Texas
- Housing Vacancy Rate by Zip Code (ZCTA5) — Texas
- Population Hispanic % by Zip Code (ZCTA5) — Alabama
- Median Age by Zip Code (ZCTA5) — Alabama
- Population Non-Hispanic Black % by Zip Code (ZCTA5) — Alabama
- Population Non-Hispanic White % by Zip Code (ZCTA5) — Alabama
- Household Median Income by Zip Code (ZCTA5) — Alabama
- Bachelor's Degree or Higher (% of Over 25) by County
- Bachelor's Degree or Higher (% of Over 25) by Zip Code (ZCTA5) — Texas
- Household Average Size by Zip Code (ZCTA5) — Texas
- Housing % of Units Built Since 2010, by Zip Code (ZCTA5) — Texas
- Housing Median Monthly Rent ($), by Zip Code (ZCTA5) — Texas
- % of Population without Health Insurance, by Zip Code (ZCTA5) — Texas
- Married Couple (% of all Households) by Zip Code (ZCTA5) — Texas
- % of Households with Broadband Internet, by Zip Code (ZCTA5) — Texas
- Housing Owner-Occupied % of Units, by Zip Code (ZCTA5) — Texas
- % of Households with Broadband Internet, by Zip Code (ZCTA5) — Wisconsin
- High School Graduate (% of Over 25) by Zip Code (ZCTA5) — Wisconsin
- Population Non-Hispanic American Indian % by Zip Code (ZCTA5) — Wisconsin
- Population Non-Hispanic Black % by Zip Code (ZCTA5) — Wisconsin
- % of Population on Food Stamps or SNAP (Last 12 Months), by Zip Code (ZCTA5) — Wisconsin
- Population Non-Hispanic White % by Zip Code (ZCTA5) — Wisconsin
- Median Age by Zip Code (ZCTA5) — Wisconsin
- Married Couple (% of all Households) by Zip Code (ZCTA5) — Wisconsin
- Population Hispanic % by Zip Code (ZCTA5) — Wisconsin
- Bachelor's Degree or Higher (% of Over 25) by Zip Code (ZCTA5) — Wisconsin
- Household Average Size by Zip Code (ZCTA5) — Wisconsin
- Housing Vacancy Rate by Zip Code (ZCTA5) — Wisconsin
- Housing Owner-Occupied Median Value ($), by Zip Code (ZCTA5) — Wisconsin
- Housing Median Monthly Rent ($), by Zip Code (ZCTA5) — Wisconsin
- U.S. Citizens (% of Population Over 18) by Zip Code (ZCTA5) — Alaska
- U.S. Citizens (% of Population Over 18) by Zip Code (ZCTA5) — Ohio
- U.S. Citizens (% of Population Over 18) by Zip Code (ZCTA5) — Utah
- U.S. Citizens (% of Population Over 18) by Zip Code (ZCTA5) — Oregon
- U.S. Citizens (% of Population Over 18) by Zip Code (ZCTA5) — Iowa
- U.S. Citizens (% of Population Over 18) by Zip Code (ZCTA5) — Oklahoma
- U.S. Citizens (% of Population Over 18) by Zip Code (ZCTA5) — Arizona
- U.S. Citizens (% of Population Over 18) by Zip Code (ZCTA5) — Texas
- U.S. Citizens (% of Population Over 18) by Zip Code (ZCTA5) — Idaho
- U.S. Citizens (% of Population Over 18) by Zip Code (ZCTA5) — Maine