NOTE: Gray indicates insufficient data or a suppressed estimate.
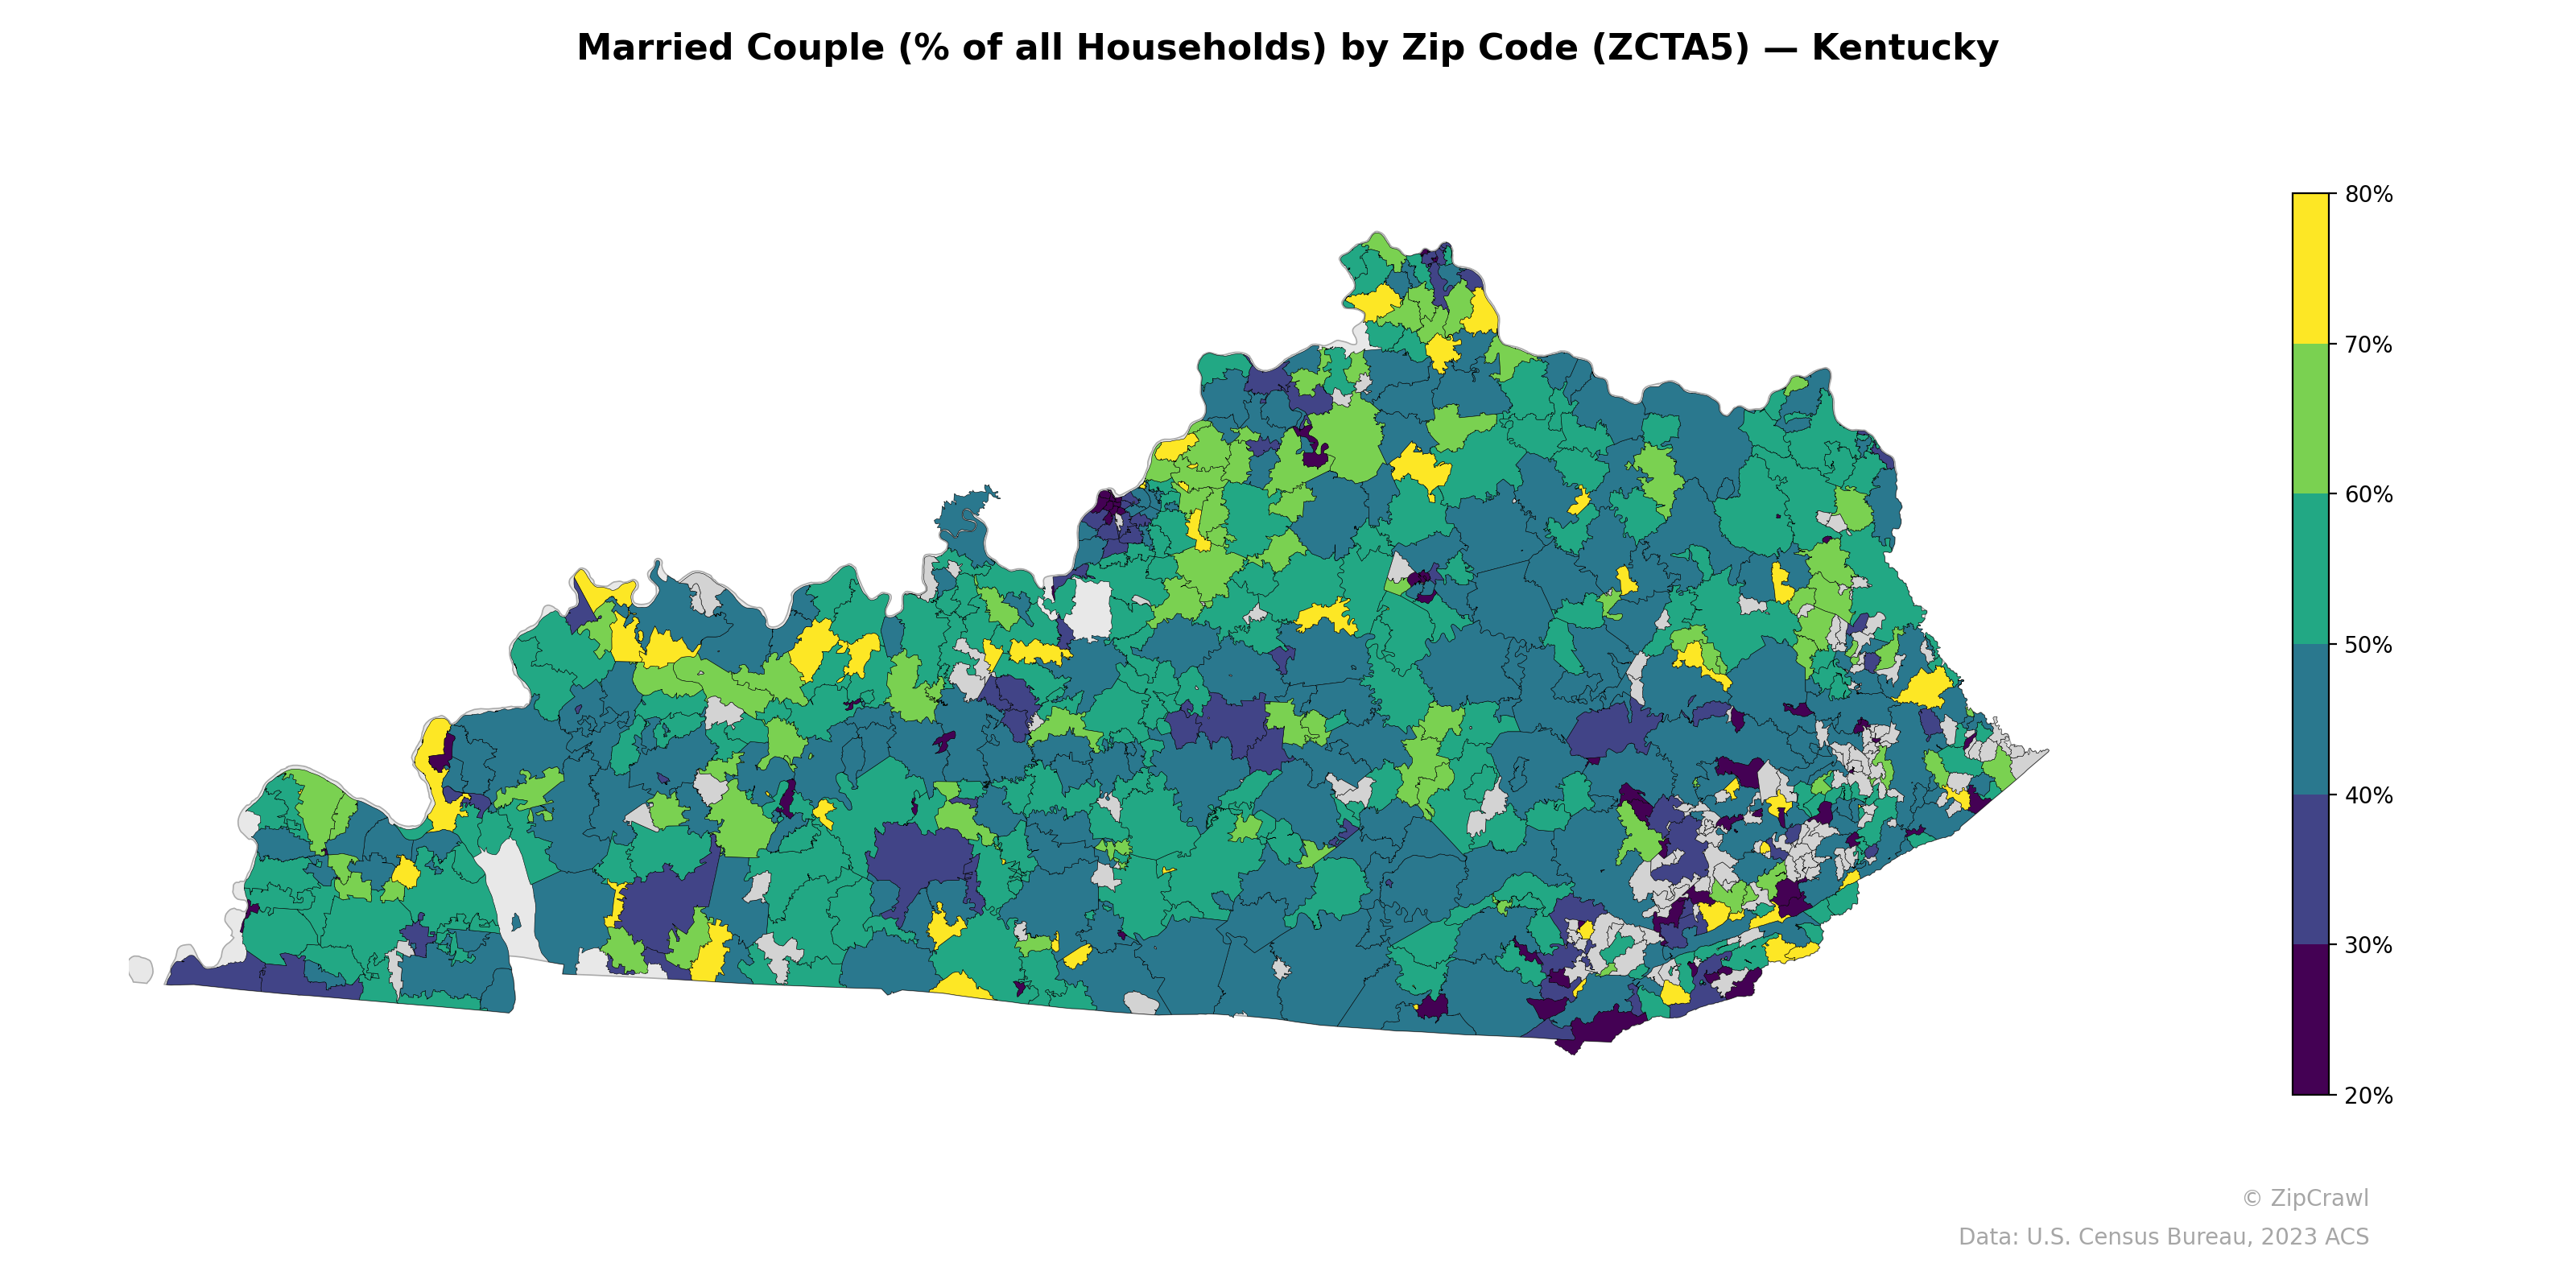
Zip codes in northern Kentucky along the Ohio River border and in the outer suburban rings of Louisville and Lexington consistently display married-couple household rates above 60%, with several exceeding 70%, reflecting the prevalence of family-oriented suburban communities. In contrast, urban cores—particularly areas corresponding to downtown Louisville, Lexington, and smaller regional centers like Bowling Green and Ashland—register notably lower rates in the 20–35% range, appearing as dark purple clusters. The southeastern Appalachian region exhibits considerable variability, with pockets of very low married-couple percentages interspersed among moderate-rate zip codes, suggesting localized demographic and economic factors driving household composition differences.
Data: U.S. Census Bureau, 2023 ACS
Explore
- Population Non-Hispanic White % by Zip Code (ZCTA5) — California
- Housing Vacancy Rate by Zip Code (ZCTA5) — Kentucky
- Population Non-Hispanic Asian % by Zip Code (ZCTA5) — Kentucky
- % of Population on Food Stamps or SNAP (Last 12 Months), by Zip Code (ZCTA5) — Kentucky
- % of Households with Broadband Internet, by County
- % of Population on Food Stamps or SNAP (Last 12 Months), by Zip Code (ZCTA5) — Texas
- U.S. Citizens (% of Population Over 18) by Zip Code (ZCTA5) — California
- Population Hispanic % by Zip Code (ZCTA5) — California
- Population Non-Hispanic Black % by Zip Code (ZCTA5) — California
- Median Age by Zip Code (ZCTA5) — California
- Population Non-Hispanic American Indian % by Zip Code (ZCTA5) — California
- Population Non-Hispanic Asian % by Zip Code (ZCTA5) — Texas
- Household Median Income by Zip Code (ZCTA5) — California
- High School Graduate (% of Over 25) by Zip Code (ZCTA5) — California
- Bachelor's Degree or Higher (% of Over 25) by Zip Code (ZCTA5) — New York
- Housing Owner-Occupied Median Value ($), by Zip Code (ZCTA5) — Alabama
- Housing Owner-Occupied % of Units, by Zip Code (ZCTA5) — Alabama
- Housing Median Monthly Rent ($), by Zip Code (ZCTA5) — Alabama
- Population Hispanic % by Zip Code (ZCTA5) — Louisiana
- % of Households with Broadband Internet, by Zip Code (ZCTA5) — Alabama
- Housing % of Units Built Since 2010, by Zip Code (ZCTA5) — Alabama
- Housing Vacancy Rate by Zip Code (ZCTA5) — Alabama
- High School Graduate (% of Over 25) by Zip Code (ZCTA5) — Alabama
- Bachelor's Degree or Higher (% of Over 25) by Zip Code (ZCTA5) — Alabama
- Household Average Size by Zip Code (ZCTA5) — Alabama
- Population Non-Hispanic Asian % by Zip Code (ZCTA5) — Alabama
- Population Non-Hispanic American Indian % by Zip Code (ZCTA5) — Alabama
- % of Population without Health Insurance, by Zip Code (ZCTA5) — Alabama
- Median Age by Zip Code (ZCTA5) — Louisiana
- U.S. Citizens (% of Population Over 18) by Zip Code (ZCTA5) — Louisiana
- Married Couple (% of all Households) by Zip Code (ZCTA5) — Ohio
- Married Couple (% of all Households) by Zip Code (ZCTA5) — Maine
- Married Couple (% of all Households) by Zip Code (ZCTA5) — Kansas
- Married Couple (% of all Households) by Zip Code (ZCTA5) — Iowa
- Married Couple (% of all Households) by Zip Code (ZCTA5) — Alaska
- Married Couple (% of all Households) by Zip Code (ZCTA5) — Utah
- Married Couple (% of all Households) by Zip Code (ZCTA5) — Alabama
- Married Couple (% of all Households) by Zip Code (ZCTA5) — Texas
- Married Couple (% of all Households) by Zip Code (ZCTA5) — Oregon
- Married Couple (% of all Households) by Zip Code (ZCTA5) — Maryland