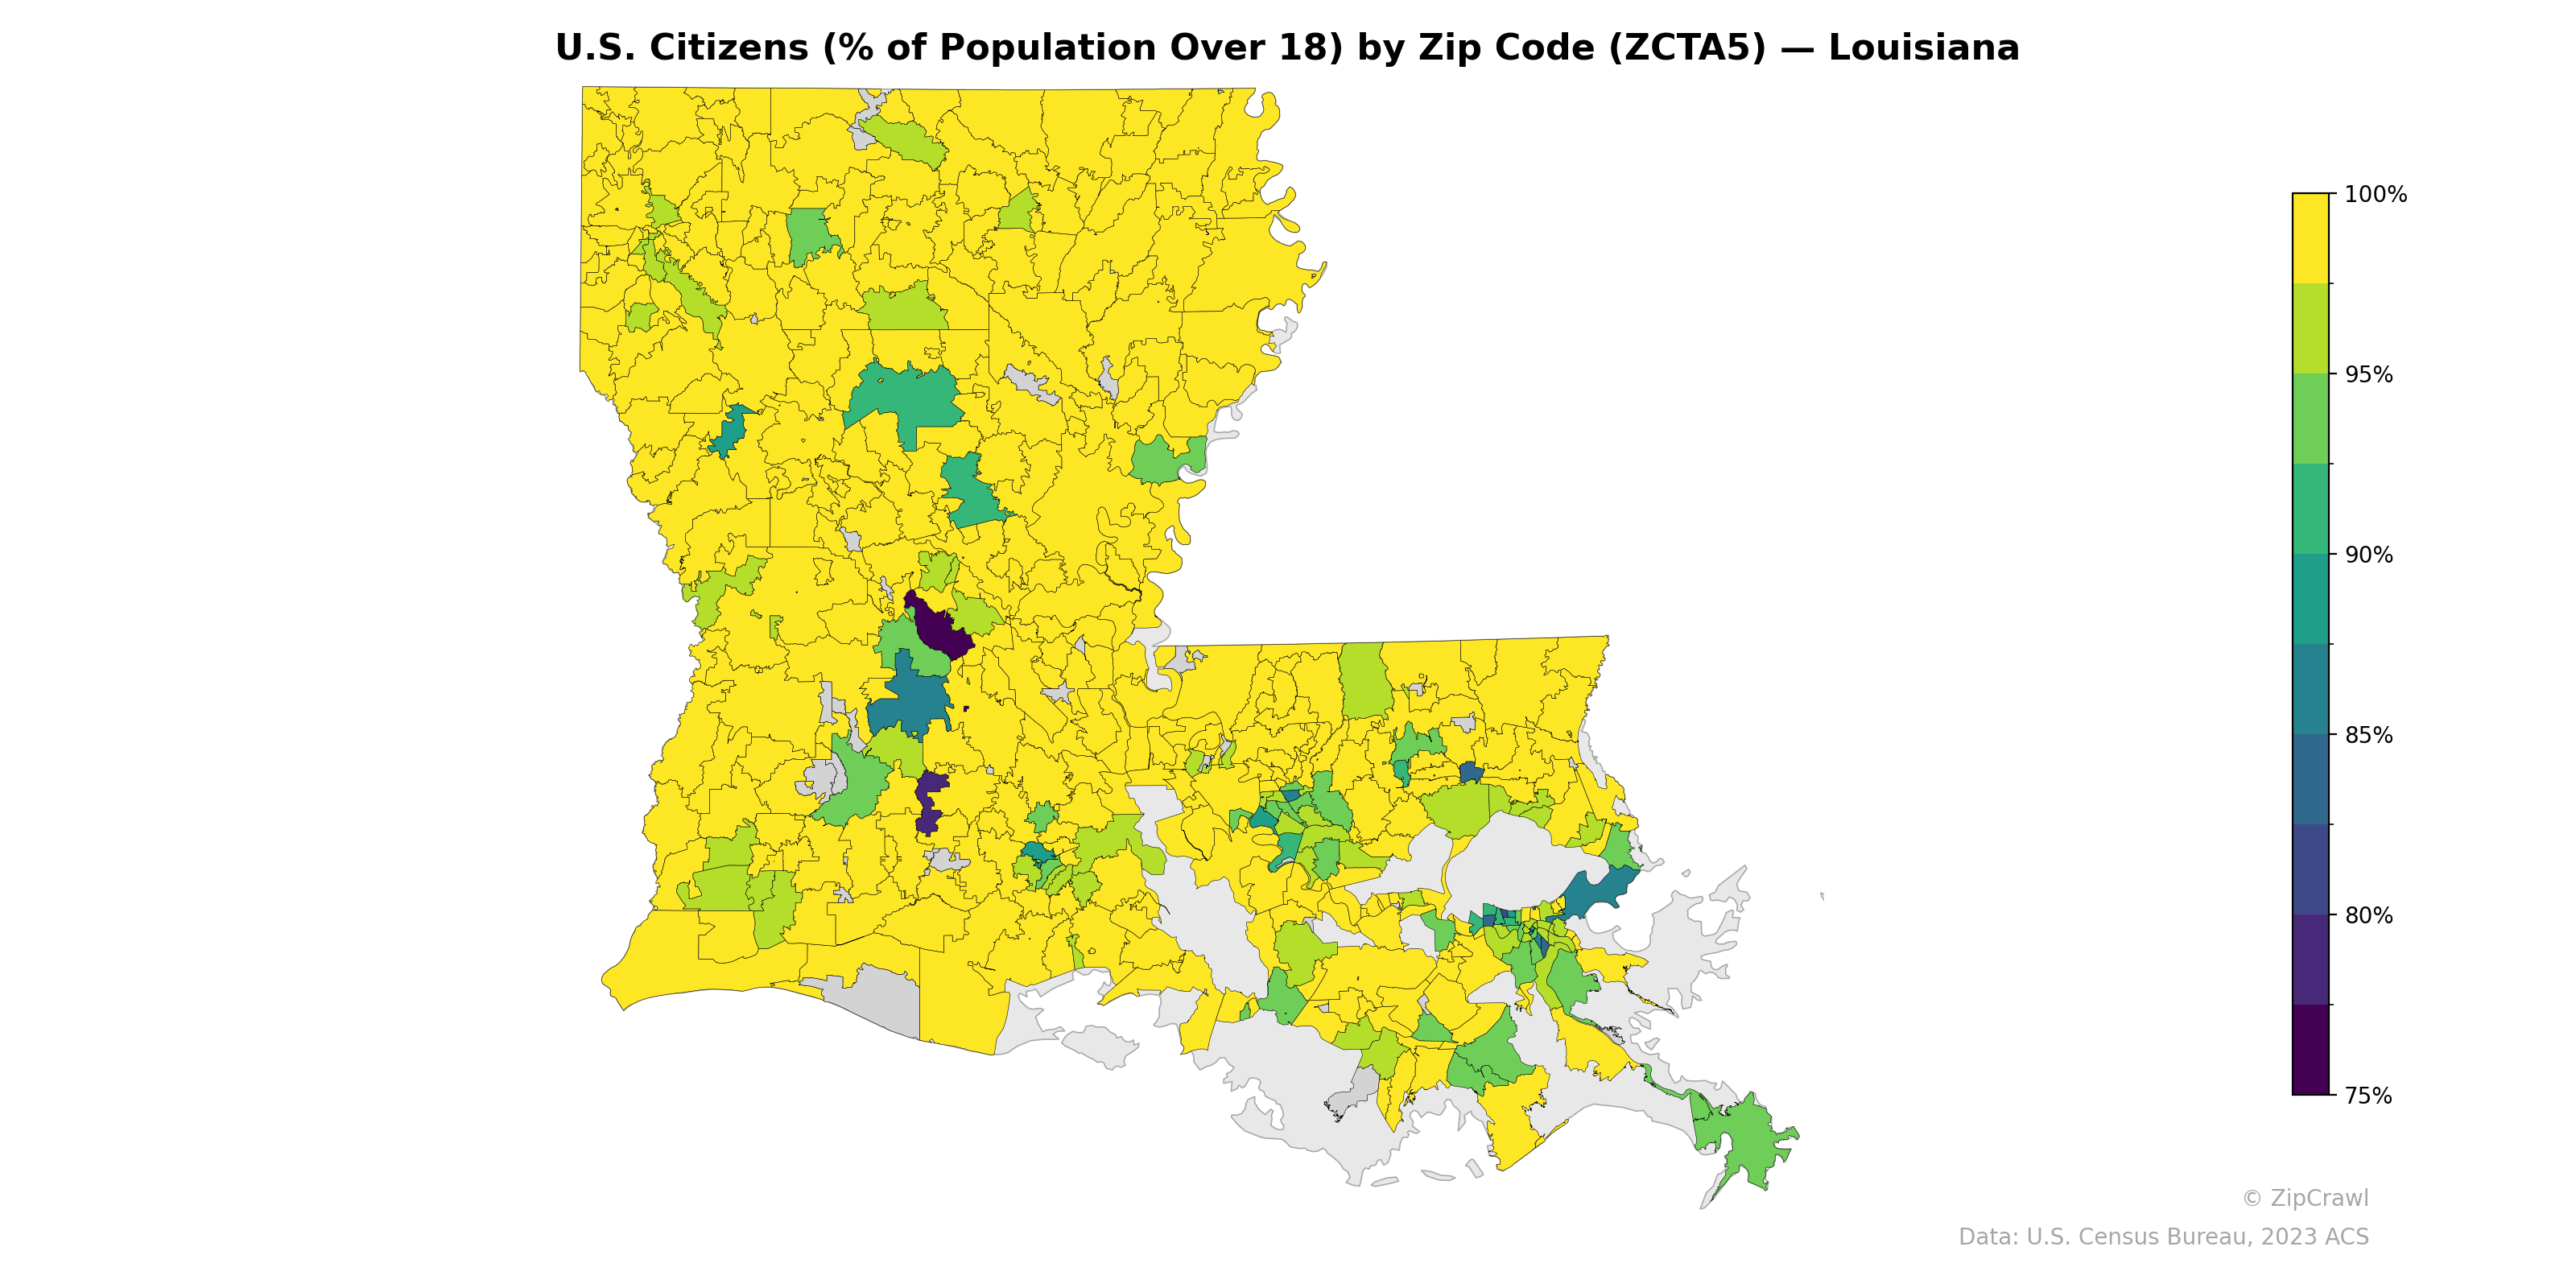
NOTE: Gray indicates insufficient data or a suppressed estimate.
The vast majority of Louisiana zip codes report U.S. citizenship rates above 95% among the adult population, with near-universal citizenship across the northern and central rural parishes. Notable exceptions cluster around the Baton Rouge metro area, where several zip codes dip below 80%, and in the greater New Orleans/Jefferson Parish region in the southeast, which displays a mix of lower-citizenship zip codes likely reflecting immigrant-heavy communities. Scattered pockets of moderately lower citizenship rates also appear in the Acadiana region west of Baton Rouge, consistent with areas known for larger Hispanic and Vietnamese immigrant populations.
Data: U.S. Census Bureau, 2023 ACS
Explore
- % of Population on Food Stamps or SNAP (Last 12 Months), by Zip Code (ZCTA5) — Texas
- Population Non-Hispanic Black % by Zip Code (ZCTA5) — Louisiana
- Population Non-Hispanic White % by Zip Code (ZCTA5) — Louisiana
- Housing Vacancy Rate by Zip Code (ZCTA5) — Alabama
- Married Couple (% of all Households) by Zip Code (ZCTA5) — Alabama
- Population Non-Hispanic Asian % by Zip Code (ZCTA5) — Alabama
- Household Median Income by Zip Code (ZCTA5) — Louisiana
- Population Hispanic % by Zip Code (ZCTA5) — Louisiana
- % of Population on Food Stamps or SNAP (Last 12 Months), by Zip Code (ZCTA5) — Alabama
- Median Age by Zip Code (ZCTA5) — Louisiana
- % of Households with Broadband Internet, by County
- Housing Owner-Occupied Median Value ($), by Zip Code (ZCTA5) — California
- High School Graduate (% of Over 25) by Zip Code (ZCTA5) — California
- Population Hispanic % by Zip Code (ZCTA5) — California
- Household Median Income by Zip Code (ZCTA5) — California
- Median Age by Zip Code (ZCTA5) — California
- Population Non-Hispanic Black % by Zip Code (ZCTA5) — California
- Population Non-Hispanic Asian % by Zip Code (ZCTA5) — Texas
- Population Non-Hispanic White % by Zip Code (ZCTA5) — California
- Population Non-Hispanic American Indian % by Zip Code (ZCTA5) — California
- Housing % of Units Built Since 2010, by Zip Code (ZCTA5) — Alabama
- Housing Median Monthly Rent ($), by Zip Code (ZCTA5) — Alabama
- Household Average Size by Zip Code (ZCTA5) — Alabama
- % of Households with Broadband Internet, by Zip Code (ZCTA5) — Alabama
- % of Population without Health Insurance, by Zip Code (ZCTA5) — Alabama
- Housing Owner-Occupied % of Units, by Zip Code (ZCTA5) — Alabama
- High School Graduate (% of Over 25) by Zip Code (ZCTA5) — Alabama
- Housing Owner-Occupied Median Value ($), by Zip Code (ZCTA5) — Alabama
- Bachelor's Degree or Higher (% of Over 25) by Zip Code (ZCTA5) — Alabama
- Population Non-Hispanic American Indian % by Zip Code (ZCTA5) — Alabama
- U.S. Citizens (% of Population Over 18) by Zip Code (ZCTA5) — Indiana
- U.S. Citizens (% of Population Over 18) by Zip Code (ZCTA5) — St. Louis Metro
- U.S. Citizens (% of Population Over 18) by Zip Code (ZCTA5) — Montana
- U.S. Citizens (% of Population Over 18) by Zip Code (ZCTA5) — Ohio
- U.S. Citizens (% of Population Over 18) by Zip Code (ZCTA5) — Utah
- U.S. Citizens (% of Population Over 18) by Zip Code (ZCTA5) — Iowa
- U.S. Citizens (% of Population Over 18) by Zip Code (ZCTA5) — Oregon
- U.S. Citizens (% of Population Over 18) by Zip Code (ZCTA5) — Arizona
- U.S. Citizens (% of Population Over 18) by Zip Code (ZCTA5) — Texas
- U.S. Citizens (% of Population Over 18) by Zip Code (ZCTA5) — Idaho