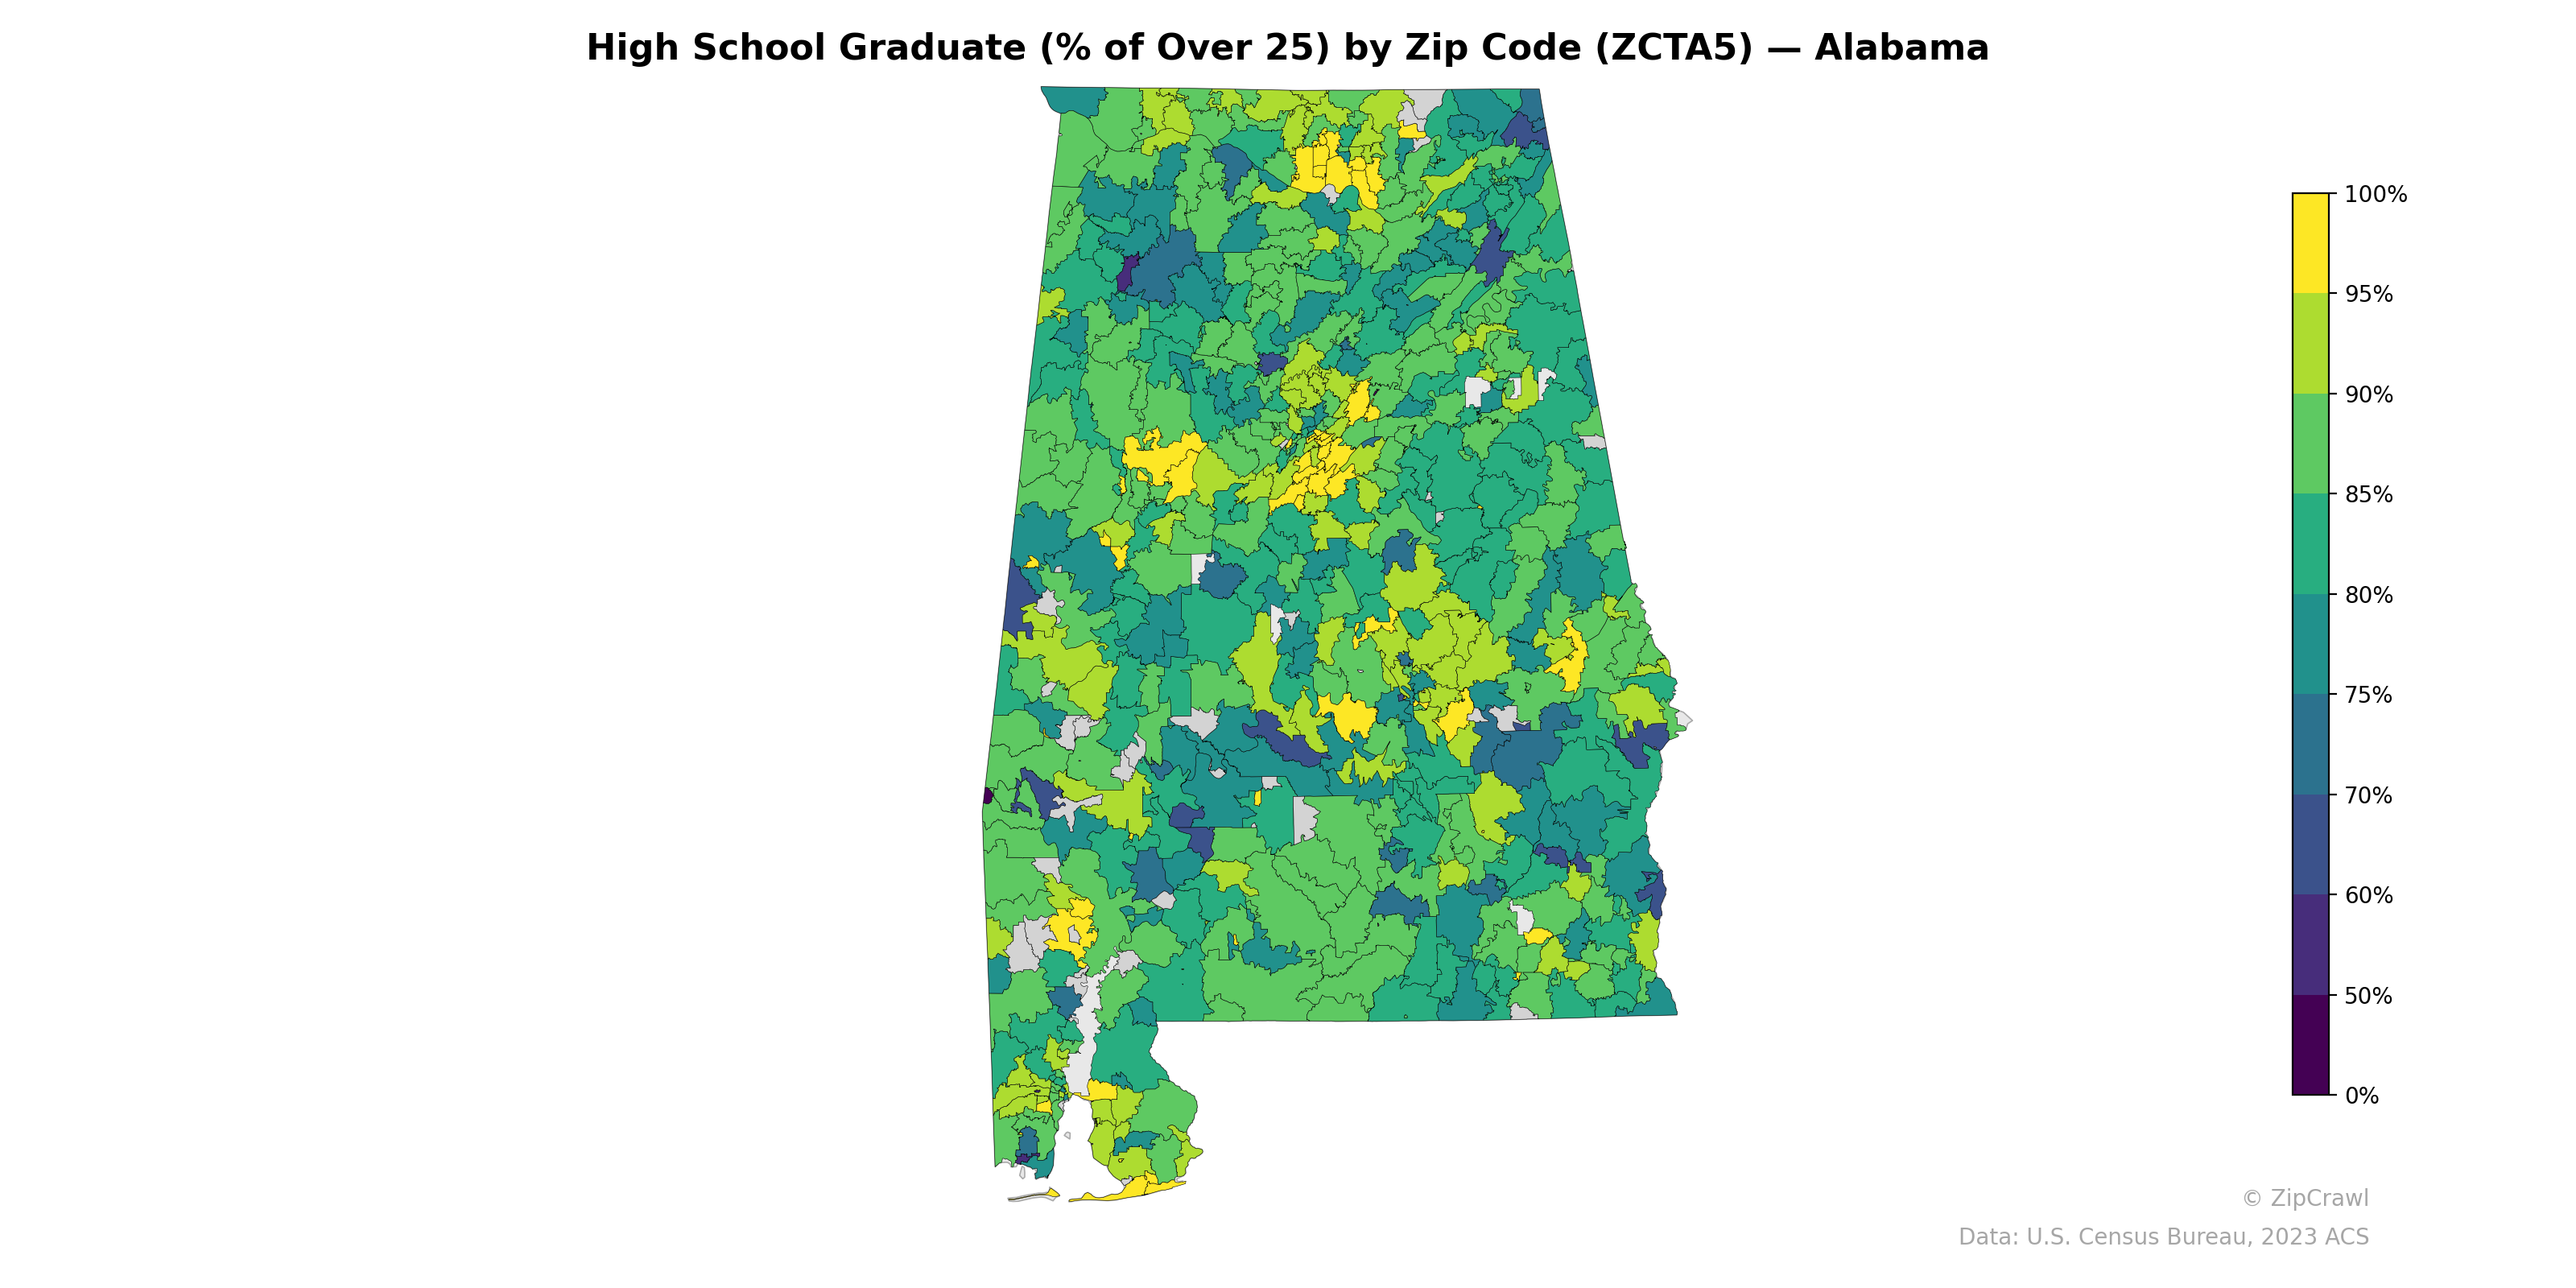
NOTE: Gray indicates insufficient data or a suppressed estimate.
High school graduation rates across Alabama zip codes reveal a pronounced rural-urban divide, with the Black Belt region in the south-central part of the state displaying consistently lower attainment levels (often below 75%), appearing in darker teal and blue tones. Suburban zip codes surrounding Birmingham, Huntsville, and the northern metropolitan corridors cluster at 90–100%, forming distinct bright yellow pockets that contrast sharply with adjacent lower-performing areas. Coastal zip codes near Mobile show considerable variability, with some areas approaching state highs while nearby zones dip below 70%, suggesting localized socioeconomic disparities even within the same metro region.
Data: U.S. Census Bureau, 2023 ACS
Explore
- Population Non-Hispanic Asian % by Zip Code (ZCTA5) — Texas
- % of Population on Food Stamps or SNAP (Last 12 Months), by Zip Code (ZCTA5) — Texas
- Housing % of Units Built Since 2010, by Zip Code (ZCTA5) — Alabama
- Housing Owner-Occupied Median Value ($), by Zip Code (ZCTA5) — Alabama
- Bachelor's Degree or Higher (% of Over 25) by Zip Code (ZCTA5) — Alabama
- Housing Median Monthly Rent ($), by Zip Code (ZCTA5) — Alabama
- Household Average Size by Zip Code (ZCTA5) — Alabama
- % of Households with Broadband Internet, by Zip Code (ZCTA5) — Alabama
- % of Population without Health Insurance, by Zip Code (ZCTA5) — Alabama
- Housing Owner-Occupied % of Units, by Zip Code (ZCTA5) — Alabama
- Population Non-Hispanic American Indian % by Zip Code (ZCTA5) — Alabama
- % of Households with Broadband Internet, by County
- Population Hispanic % by Zip Code (ZCTA5) — California
- Population Non-Hispanic Black % by Zip Code (ZCTA5) — California
- Population Non-Hispanic White % by Zip Code (ZCTA5) — California
- Population Non-Hispanic American Indian % by Zip Code (ZCTA5) — California
- Median Age by Zip Code (ZCTA5) — California
- U.S. Citizens (% of Population Over 18) by Zip Code (ZCTA5) — California
- Household Median Income by Zip Code (ZCTA5) — California
- Married Couple (% of all Households) by Zip Code (ZCTA5) — Alabama
- Population Non-Hispanic Asian % by Zip Code (ZCTA5) — Alabama
- Housing Vacancy Rate by Zip Code (ZCTA5) — Alabama
- Median Age by Zip Code (ZCTA5) — Louisiana
- Population Non-Hispanic White % by Zip Code (ZCTA5) — Louisiana
- U.S. Citizens (% of Population Over 18) by Zip Code (ZCTA5) — Louisiana
- % of Population on Food Stamps or SNAP (Last 12 Months), by Zip Code (ZCTA5) — Alabama
- Household Median Income by Zip Code (ZCTA5) — Louisiana
- Population Hispanic % by Zip Code (ZCTA5) — Louisiana
- Population Non-Hispanic Black % by Zip Code (ZCTA5) — Louisiana
- Population Non-Hispanic American Indian % by Zip Code (ZCTA5) — Louisiana
- High School Graduate (% of Over 25) by Zip Code (ZCTA5) — Alaska
- High School Graduate (% of Over 25) by Zip Code (ZCTA5) — Ohio
- High School Graduate (% of Over 25) by Zip Code (ZCTA5) — Utah
- High School Graduate (% of Over 25) by Zip Code (ZCTA5) — Iowa
- High School Graduate (% of Over 25) by Zip Code (ZCTA5) — Arizona
- High School Graduate (% of Over 25) by Zip Code (ZCTA5) — Oklahoma
- High School Graduate (% of Over 25) by Zip Code (ZCTA5) — Colorado
- High School Graduate (% of Over 25) by Zip Code (ZCTA5) — Texas
- High School Graduate (% of Over 25) by Zip Code (ZCTA5) — Oregon
- High School Graduate (% of Over 25) by Zip Code (ZCTA5) — Idaho