NOTE: Gray indicates insufficient data or a suppressed estimate.
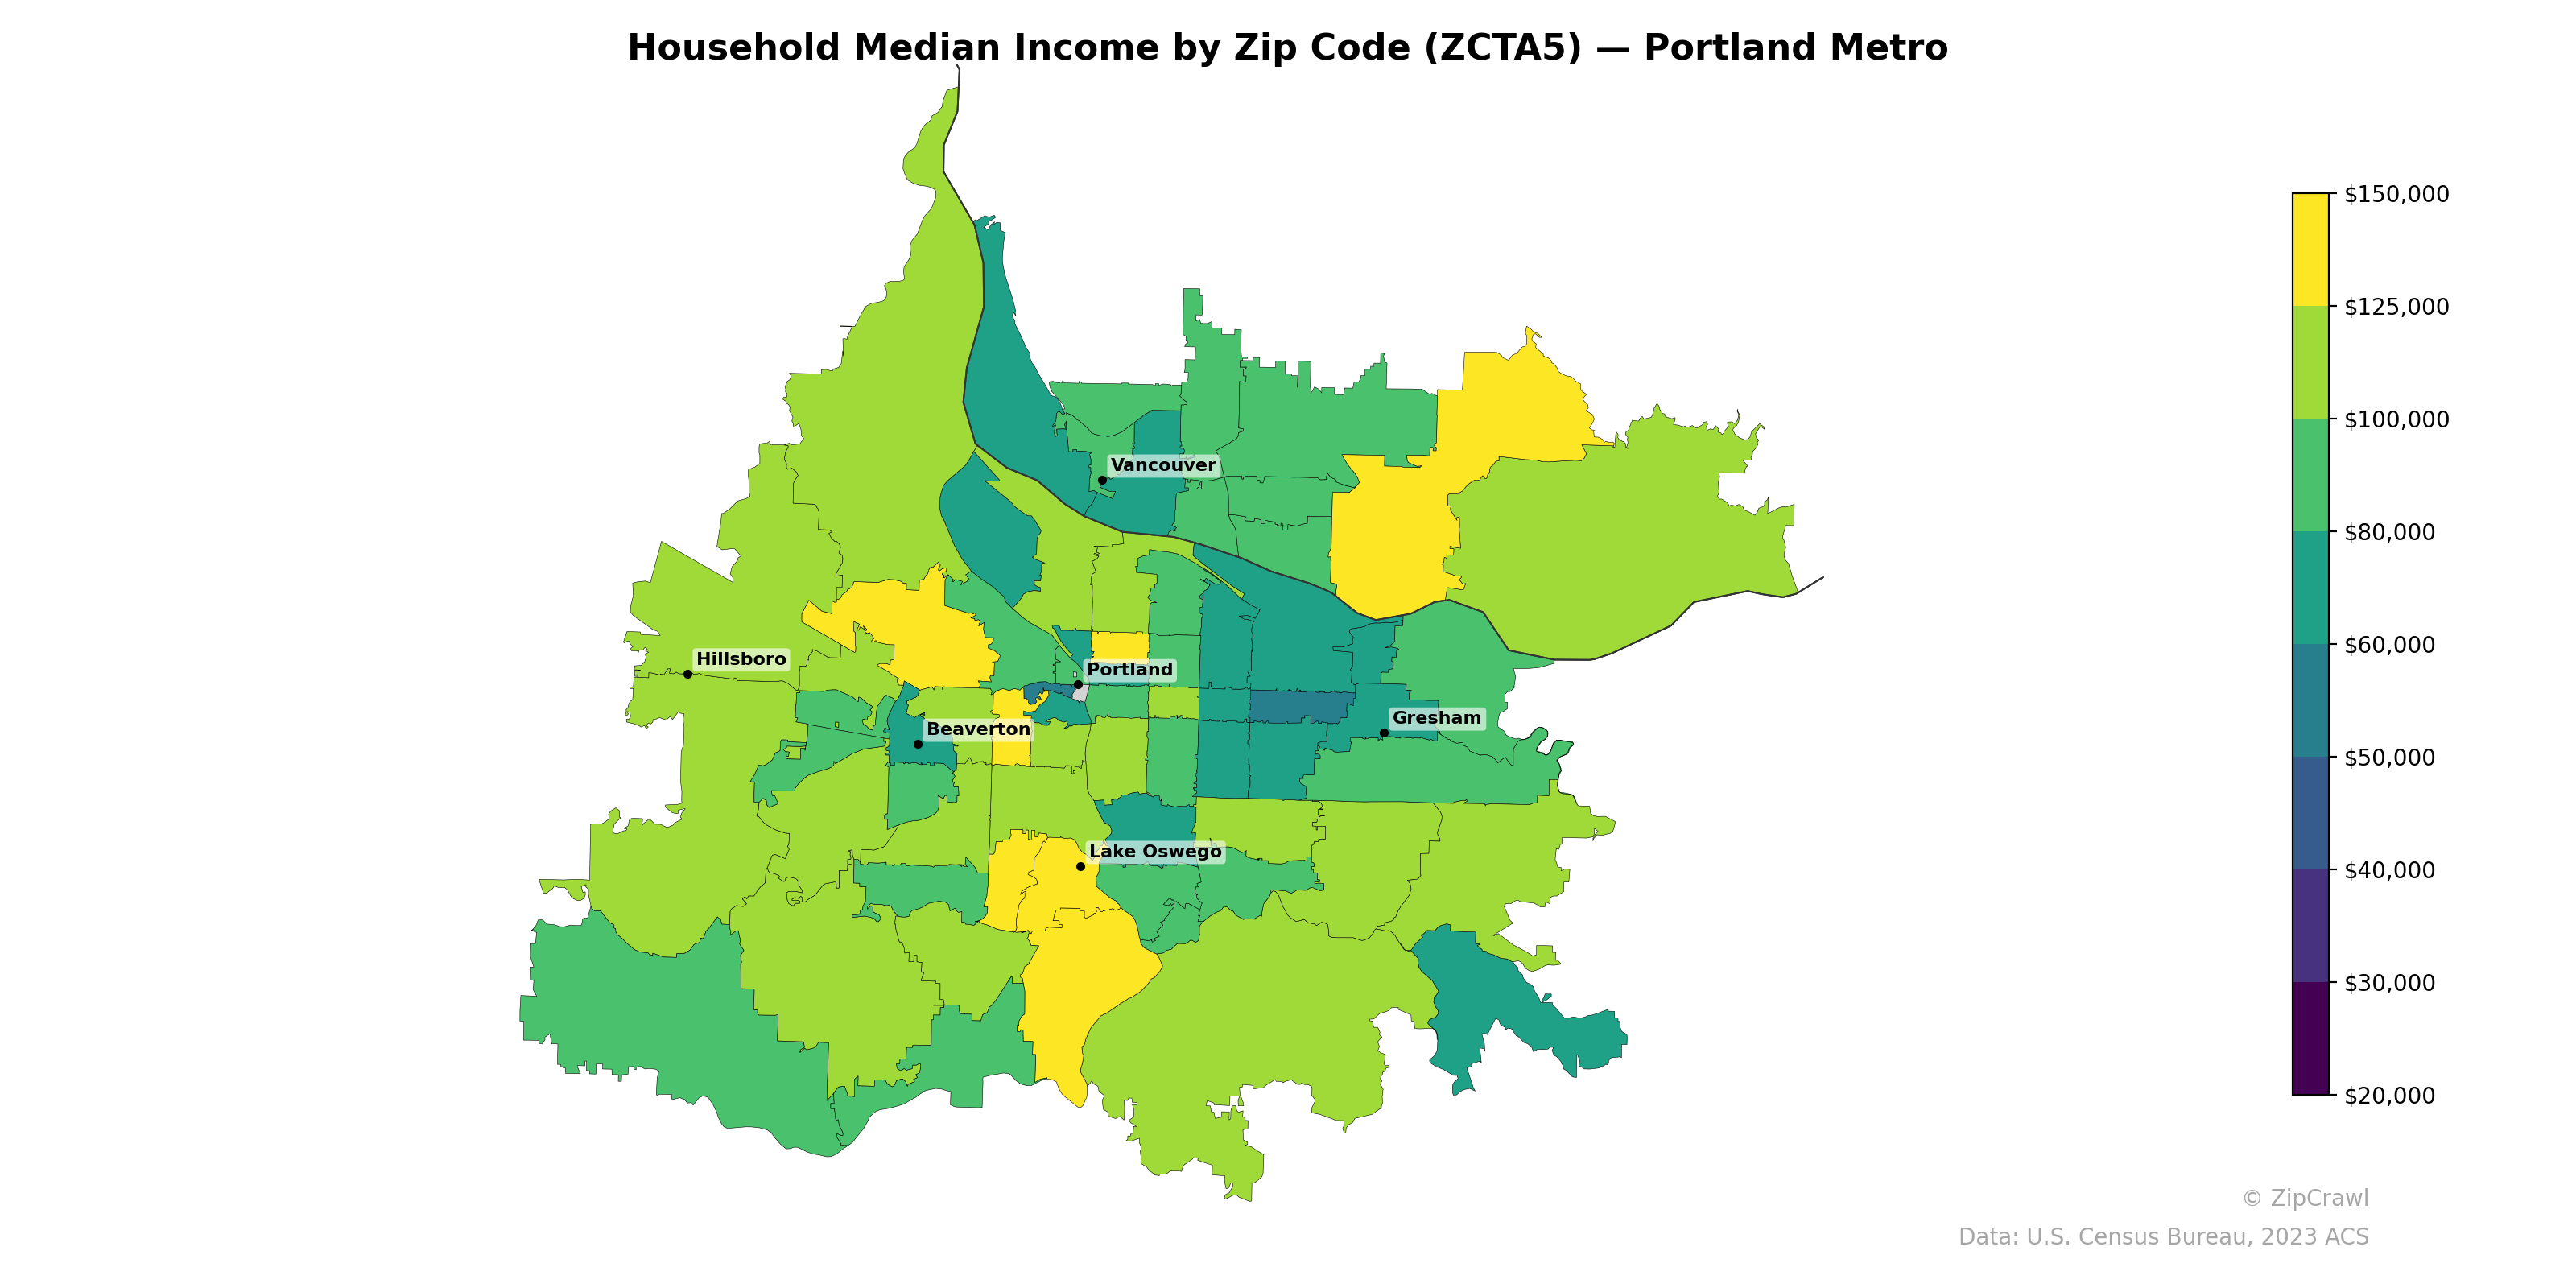
Higher-income zip codes cluster prominently in the southwestern suburbs near Lake Oswego and in parts of western Portland, where median household incomes reach $125,000–$150,000, while a distinct low-income corridor runs through inner North and Northeast Portland with values dropping below $40,000–$50,000. The east side of the metro, particularly around Gresham and outer East Portland, generally registers moderate incomes in the $50,000–$70,000 range, contrasting with the more affluent western communities including Beaverton's southern neighborhoods and areas south of Hillsboro. Vancouver's zip codes display notable internal variation, with higher incomes in the eastern portions and more modest levels closer to the city center.
Data: U.S. Census Bureau, 2023 ACS
Explore
- Population Non-Hispanic American Indian % by Zip Code (ZCTA5) — Texas
- High School Graduate (% of Over 25) by Zip Code (ZCTA5) — Portland Metro
- U.S. Citizens (% of Population Over 18) by Zip Code (ZCTA5) — Portland Metro
- Population Non-Hispanic White % by Zip Code (ZCTA5) — Portland Metro
- % of Population on Food Stamps or SNAP (Last 12 Months), by Zip Code (ZCTA5) — Austin Metro
- Median Age by Zip Code (ZCTA5) — Portland Metro
- Population Non-Hispanic Black % by Zip Code (ZCTA5) — Portland Metro
- Population Non-Hispanic American Indian % by Zip Code (ZCTA5) — Portland Metro
- Population Hispanic % by Zip Code (ZCTA5) — Portland Metro
- Population Non-Hispanic Asian % by Zip Code (ZCTA5) — Austin Metro
- High School Graduate (% of Over 25) by County
- Population Non-Hispanic White % by Zip Code (ZCTA5) — Texas
- U.S. Citizens (% of Population Over 18) by Zip Code (ZCTA5) — Texas
- Population Non-Hispanic Asian % by Zip Code (ZCTA5) — Chicago Metro
- Population Non-Hispanic Black % by Zip Code (ZCTA5) — Texas
- High School Graduate (% of Over 25) by Zip Code (ZCTA5) — Texas
- Median Age by Zip Code (ZCTA5) — Texas
- Population Hispanic % by Zip Code (ZCTA5) — Texas
- % of Population on Food Stamps or SNAP (Last 12 Months), by Zip Code (ZCTA5) — Chicago Metro
- Housing Owner-Occupied Median Value ($), by Zip Code (ZCTA5) — Baltimore Metro
- Housing Owner-Occupied % of Units, by Zip Code (ZCTA5) — Baltimore Metro
- Housing Median Monthly Rent ($), by Zip Code (ZCTA5) — Baltimore Metro
- U.S. Citizens (% of Population Over 18) by Zip Code (ZCTA5) — Baltimore Metro
- Bachelor's Degree or Higher (% of Over 25) by Zip Code (ZCTA5) — Baltimore Metro
- Population Non-Hispanic Asian % by Zip Code (ZCTA5) — Charlotte Metro
- High School Graduate (% of Over 25) by Zip Code (ZCTA5) — Baltimore Metro
- Population Non-Hispanic Asian % by Zip Code (ZCTA5) — Baltimore Metro
- % of Population without Health Insurance, by Zip Code (ZCTA5) — Baltimore Metro
- % of Population on Food Stamps or SNAP (Last 12 Months), by Zip Code (ZCTA5) — Charlotte Metro
- % of Households with Broadband Internet, by Zip Code (ZCTA5) — Baltimore Metro
- Household Median Income by Zip Code (ZCTA5) — Atlanta Metro
- Household Median Income by Zip Code (ZCTA5) — Orlando Metro
- Household Median Income by Zip Code (ZCTA5) — Houston Metro
- Household Median Income by Zip Code (ZCTA5) — Miami Metro
- Household Median Income by Zip Code (ZCTA5) — Phoenix Metro
- Household Median Income by Zip Code (ZCTA5) — Detroit Metro
- Household Median Income by Zip Code (ZCTA5) — Tampa Metro
- Household Median Income by Zip Code (ZCTA5) — Boston Metro
- Household Median Income by Zip Code (ZCTA5) — Maryland
- Household Median Income by Zip Code (ZCTA5) — Dallas Metro