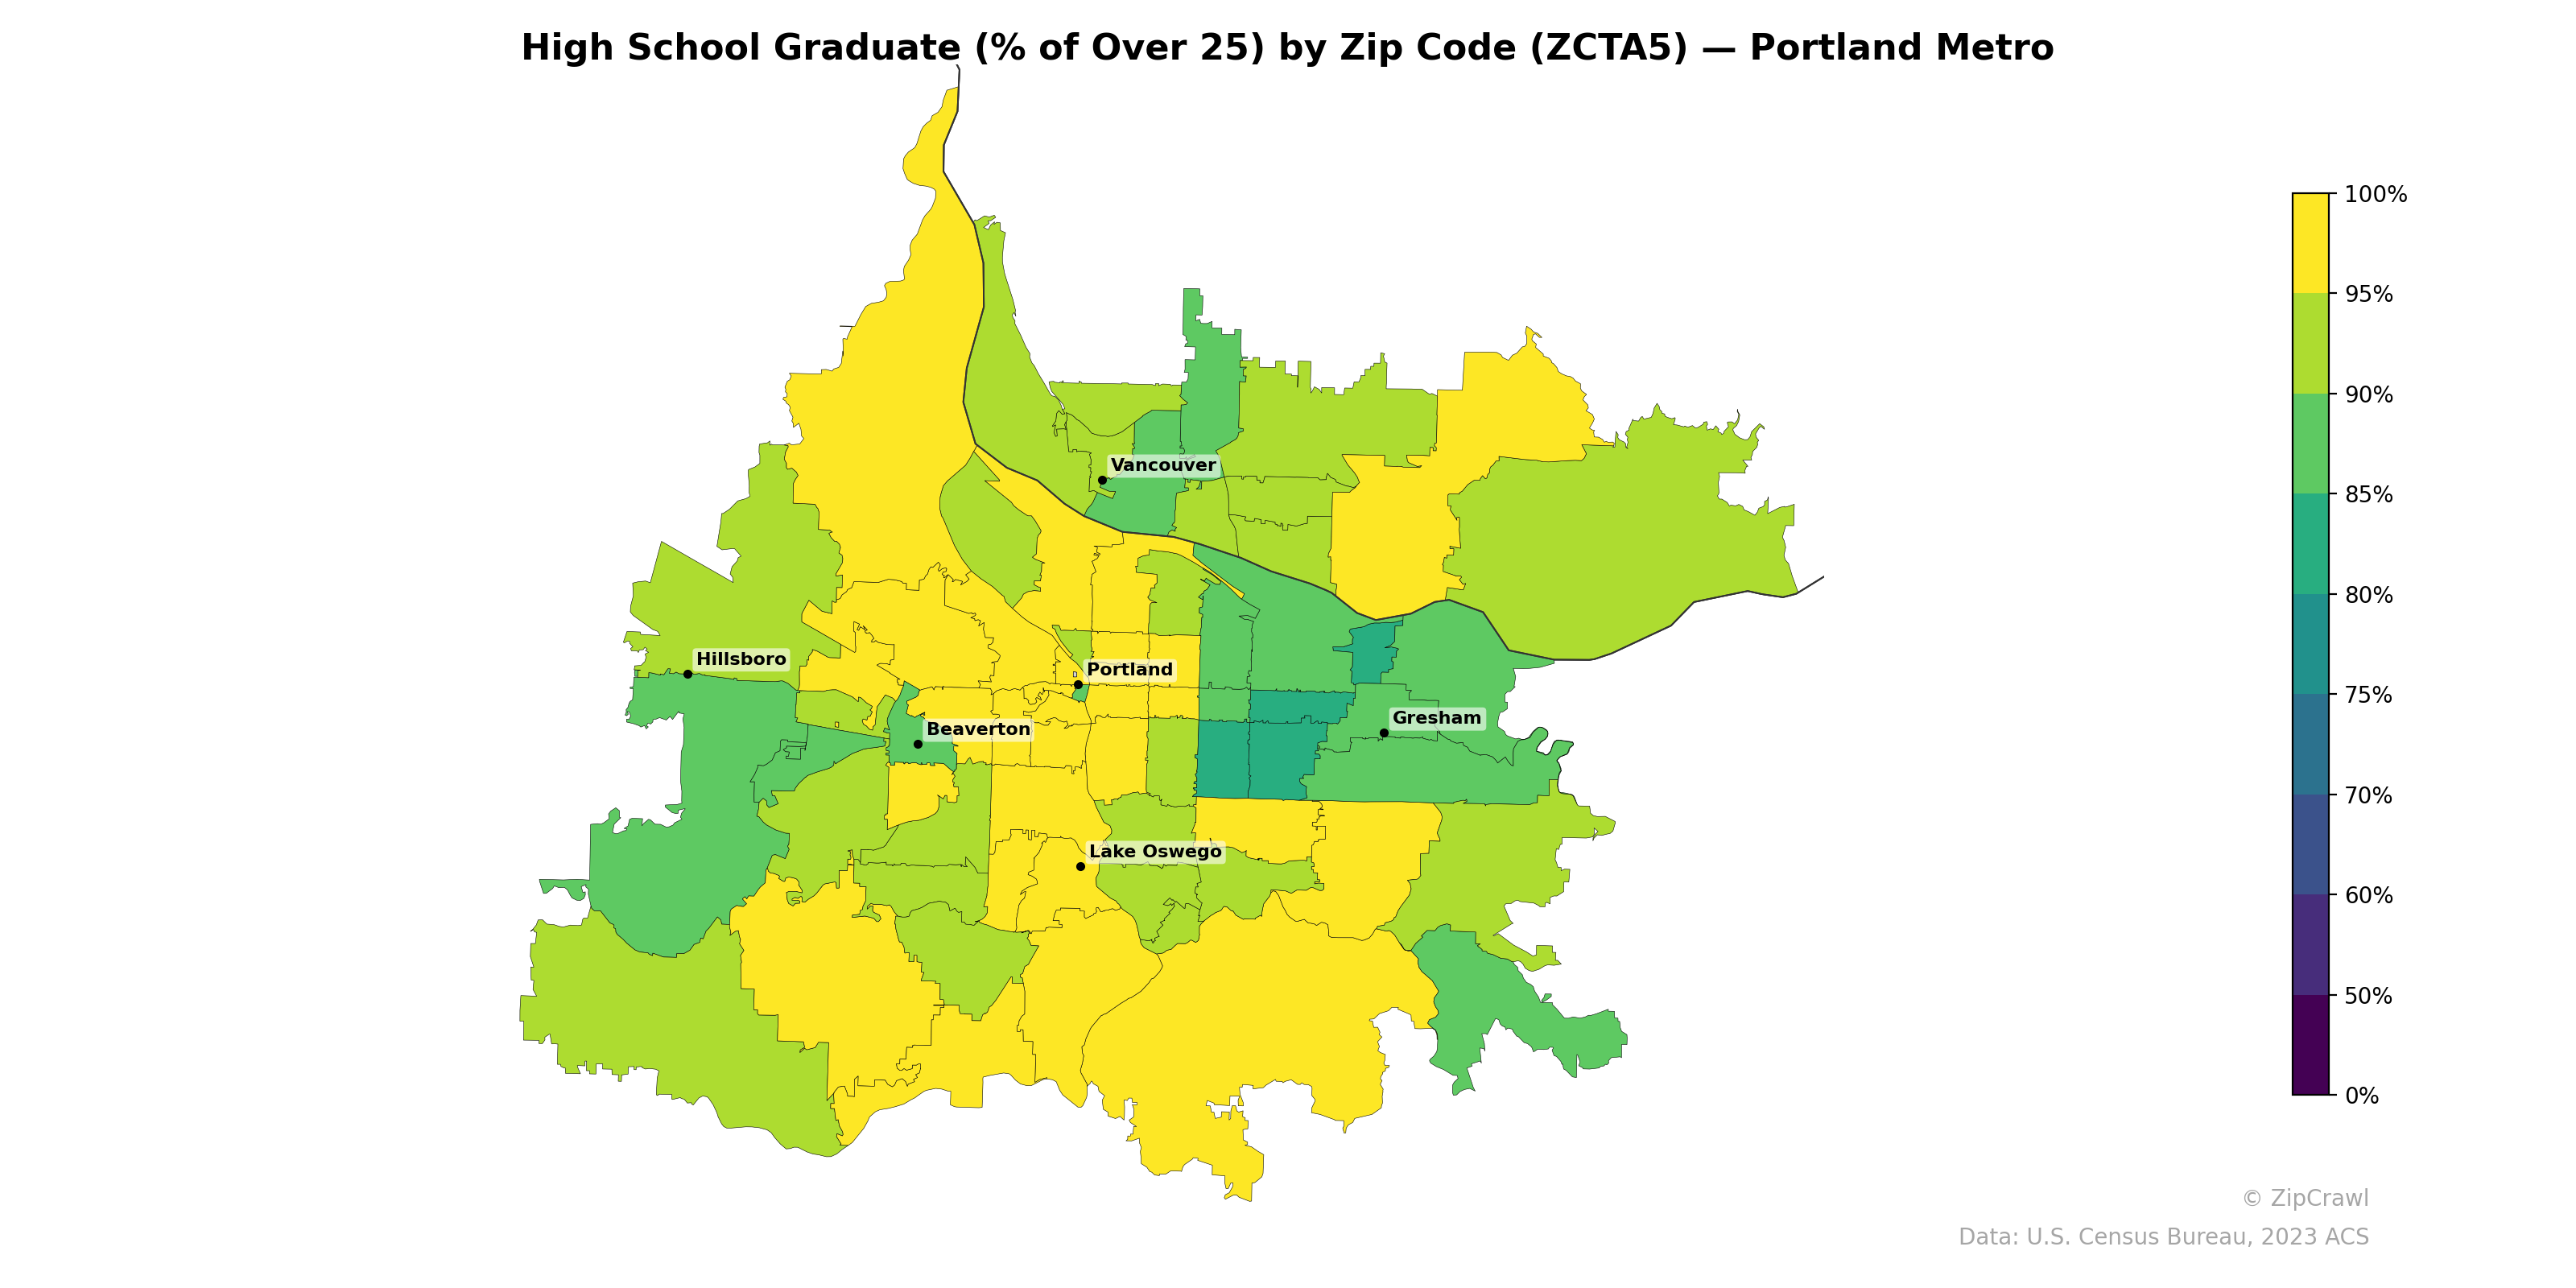
NOTE: Gray indicates insufficient data or a suppressed estimate.
High school graduation rates across the Portland metro area generally exceed 85%, with the highest concentrations (95–100%) appearing in the outer suburban areas to the south, southwest, and in parts of Lake Oswego and the far eastern periphery. A notable corridor of lower attainment (roughly 60–75%) cuts through inner southeast and northeast Portland, extending eastward toward Gresham, likely reflecting areas with higher immigrant populations and historically underserved communities. The contrast between the affluent southwestern suburbs and this central-to-eastern corridor represents the most pronounced educational attainment divide in the metro region.
Data: U.S. Census Bureau, 2023 ACS
Explore
- Population Non-Hispanic American Indian % by Zip Code (ZCTA5) — Texas
- Population Non-Hispanic Black % by Zip Code (ZCTA5) — Portland Metro
- Population Non-Hispanic Asian % by Zip Code (ZCTA5) — Austin Metro
- Median Age by Zip Code (ZCTA5) — Portland Metro
- U.S. Citizens (% of Population Over 18) by Zip Code (ZCTA5) — Portland Metro
- % of Population on Food Stamps or SNAP (Last 12 Months), by Zip Code (ZCTA5) — Austin Metro
- Population Non-Hispanic American Indian % by Zip Code (ZCTA5) — Portland Metro
- Population Hispanic % by Zip Code (ZCTA5) — Portland Metro
- Population Non-Hispanic White % by Zip Code (ZCTA5) — Portland Metro
- Household Median Income by Zip Code (ZCTA5) — Portland Metro
- Population Non-Hispanic White % by Zip Code (ZCTA5) — Texas
- U.S. Citizens (% of Population Over 18) by Zip Code (ZCTA5) — Texas
- Population Non-Hispanic Asian % by Zip Code (ZCTA5) — Chicago Metro
- Household Median Income by Zip Code (ZCTA5) — Texas
- Median Age by Zip Code (ZCTA5) — Texas
- Population Hispanic % by Zip Code (ZCTA5) — Texas
- Population Non-Hispanic Black % by Zip Code (ZCTA5) — Texas
- % of Population on Food Stamps or SNAP (Last 12 Months), by Zip Code (ZCTA5) — Chicago Metro
- Housing Median Monthly Rent ($), by Zip Code (ZCTA5) — Baltimore Metro
- Housing Owner-Occupied % of Units, by Zip Code (ZCTA5) — Baltimore Metro
- Housing % of Units Built Since 2010, by Zip Code (ZCTA5) — Baltimore Metro
- Bachelor's Degree or Higher (% of Over 25) by Zip Code (ZCTA5) — Baltimore Metro
- Population Non-Hispanic Asian % by Zip Code (ZCTA5) — Charlotte Metro
- Population Non-Hispanic Asian % by Zip Code (ZCTA5) — Baltimore Metro
- U.S. Citizens (% of Population Over 18) by Zip Code (ZCTA5) — Baltimore Metro
- Household Median Income by Zip Code (ZCTA5) — Baltimore Metro
- % of Population without Health Insurance, by Zip Code (ZCTA5) — Baltimore Metro
- % of Population on Food Stamps or SNAP (Last 12 Months), by Zip Code (ZCTA5) — Charlotte Metro
- Housing Owner-Occupied Median Value ($), by Zip Code (ZCTA5) — Baltimore Metro
- % of Households with Broadband Internet, by Zip Code (ZCTA5) — Baltimore Metro
- High School Graduate (% of Over 25) by Zip Code (ZCTA5) — Orlando Metro
- High School Graduate (% of Over 25) by Zip Code (ZCTA5) — Atlanta Metro
- High School Graduate (% of Over 25) by Zip Code (ZCTA5) — Denver Metro
- High School Graduate (% of Over 25) by Zip Code (ZCTA5) — Miami Metro
- High School Graduate (% of Over 25) by Zip Code (ZCTA5) — Phoenix Metro
- High School Graduate (% of Over 25) by Zip Code (ZCTA5) — Tampa Metro
- High School Graduate (% of Over 25) by Zip Code (ZCTA5) — Boston Metro
- High School Graduate (% of Over 25) by Zip Code (ZCTA5) — Detroit Metro
- High School Graduate (% of Over 25) by Zip Code (ZCTA5) — Dallas Metro
- High School Graduate (% of Over 25) by Zip Code (ZCTA5) — Houston Metro