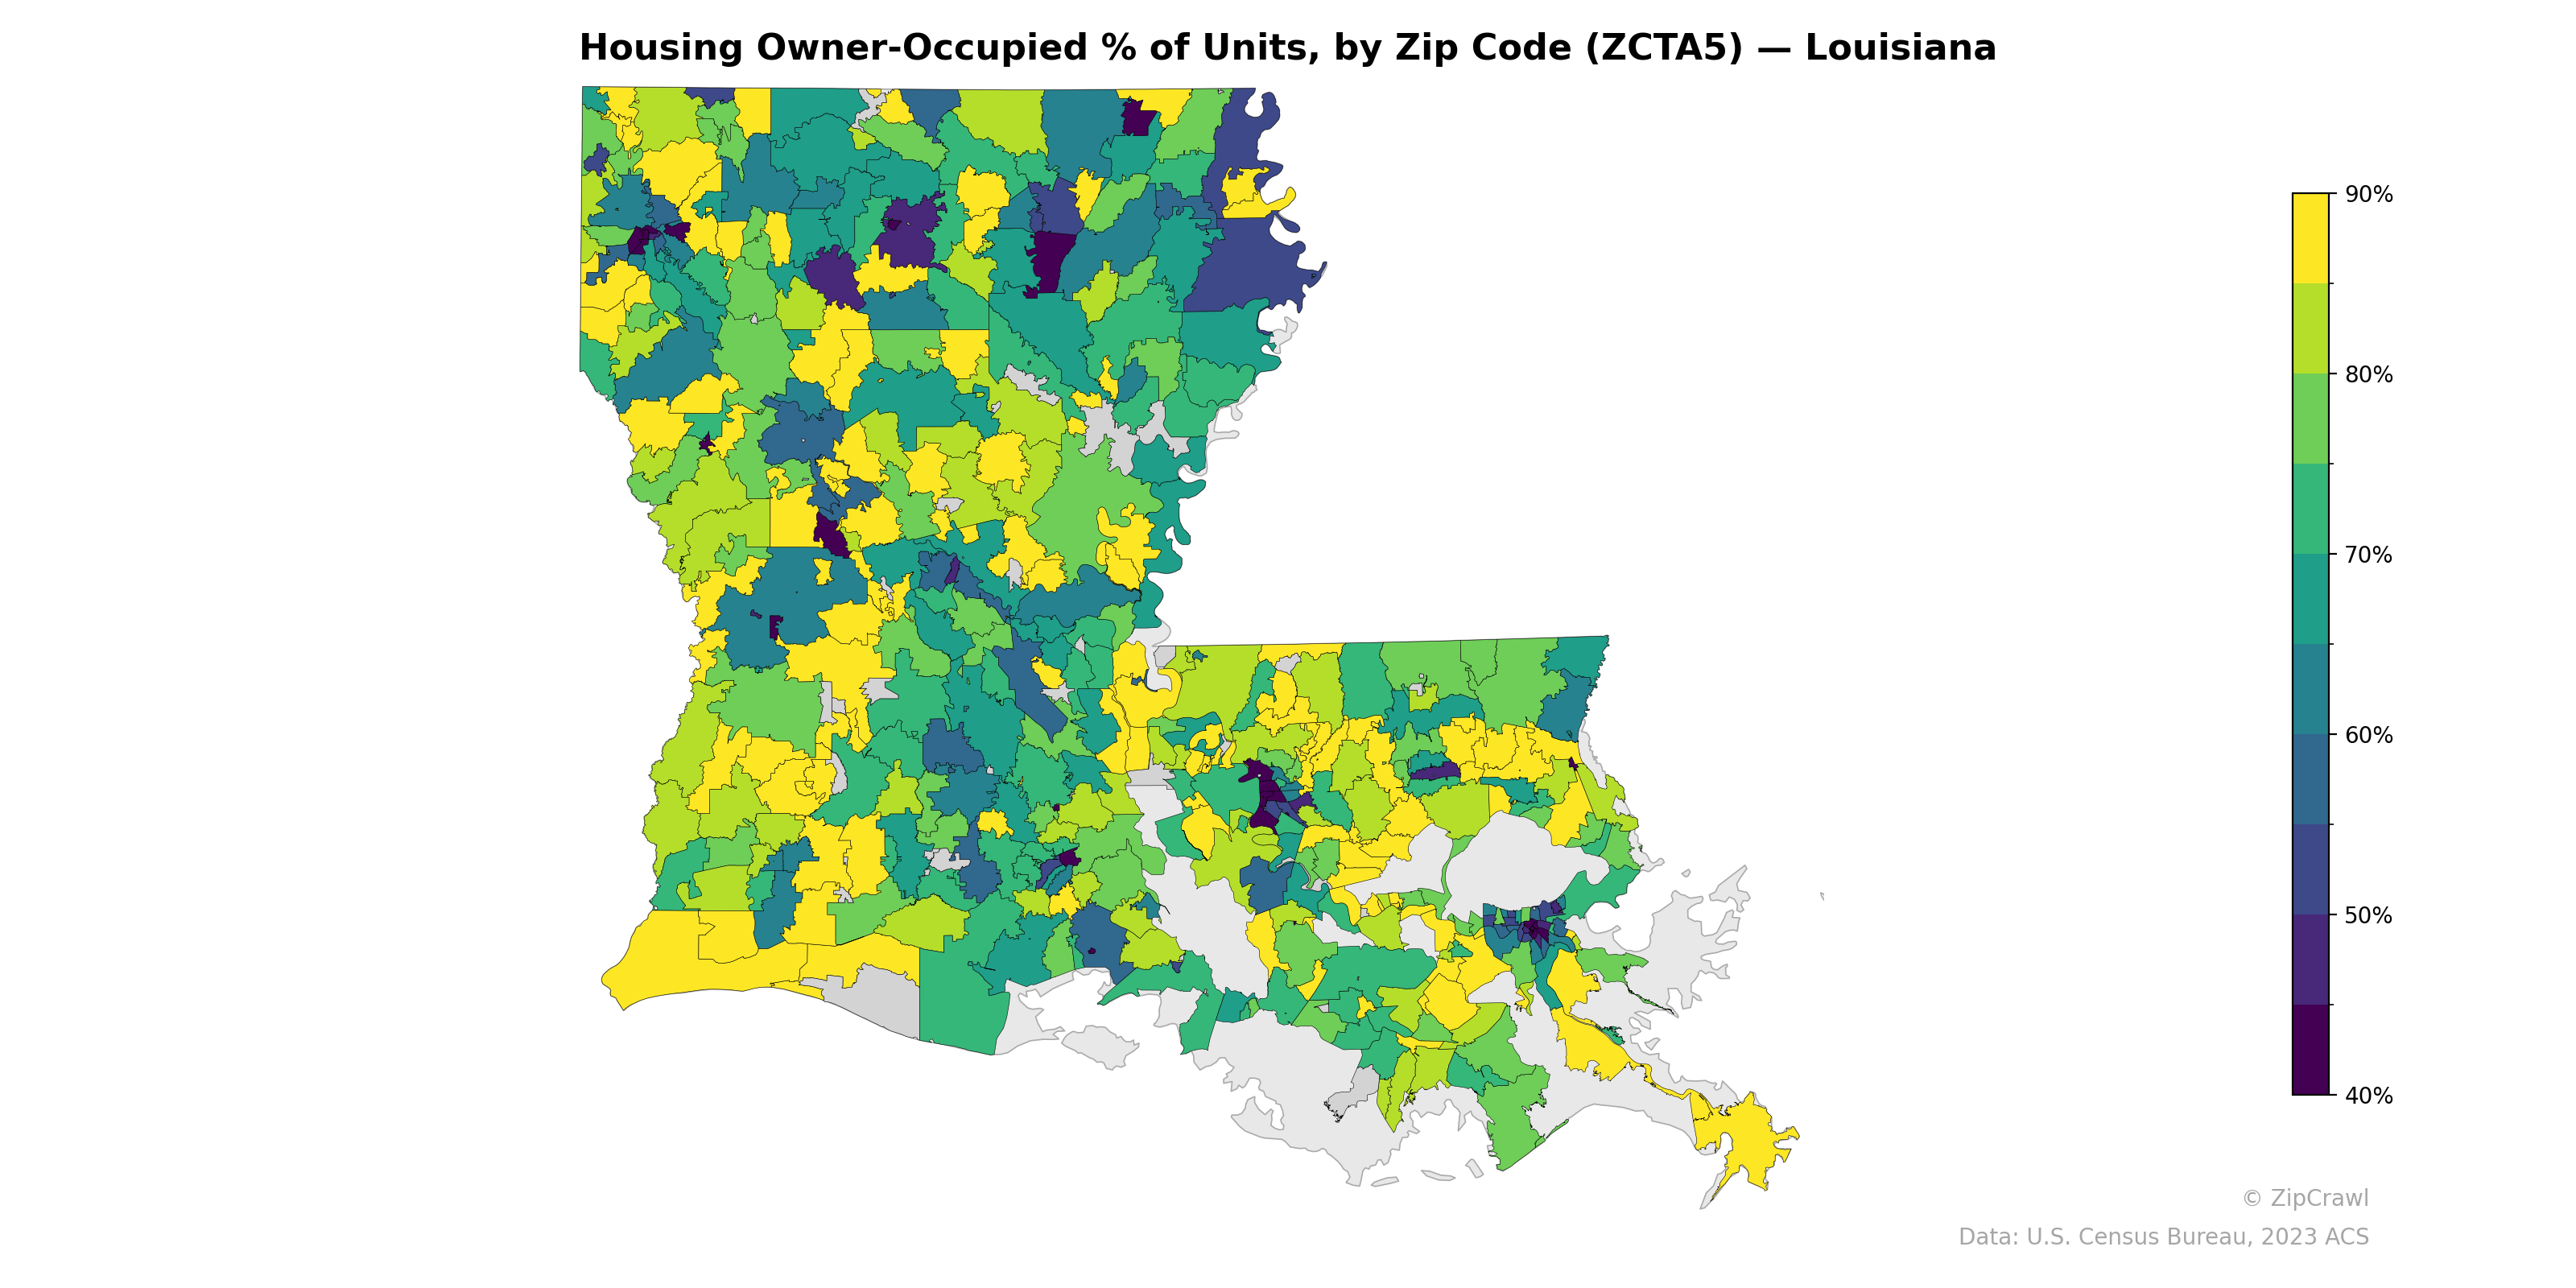
NOTE: Gray indicates insufficient data or a suppressed estimate.
Owner-occupancy rates across Louisiana exhibit a clear urban-rural divide, with metropolitan cores—particularly New Orleans in the southeast, Shreveport in the northwest, and Baton Rouge in the south-central region—displaying notably lower rates (below 50%) in dark purple and teal tones, while surrounding suburban and rural zip codes consistently reach 80–90%. The southeastern coastal parishes and the New Orleans metro area form the most pronounced cluster of low owner-occupancy, likely reflecting higher concentrations of rental housing, transient populations, and post-disaster housing dynamics. Northern Louisiana shows a more heterogeneous patchwork, with scattered high-ownership yellow zip codes interspersed among moderate-rate areas, suggesting localized variation tied to small-town economies and land-use patterns.
Data: U.S. Census Bureau, 2023 ACS
Explore
- U.S. Citizens (% of Population Over 18) by Zip Code (ZCTA5) — California
- Housing % of Units Built Since 2010, by Zip Code (ZCTA5) — Louisiana
- High School Graduate (% of Over 25) by Zip Code (ZCTA5) — Louisiana
- Housing Median Monthly Rent ($), by Zip Code (ZCTA5) — Louisiana
- % of Households with Broadband Internet, by Zip Code (ZCTA5) — Louisiana
- Household Average Size by Zip Code (ZCTA5) — Louisiana
- Bachelor's Degree or Higher (% of Over 25) by Zip Code (ZCTA5) — Louisiana
- Housing Owner-Occupied Median Value ($), by Zip Code (ZCTA5) — Louisiana
- Population Non-Hispanic American Indian % by Zip Code (ZCTA5) — Louisiana
- % of Population without Health Insurance, by Zip Code (ZCTA5) — Louisiana
- % of Households with Broadband Internet, by County
- Population Non-Hispanic American Indian % by Zip Code (ZCTA5) — California
- Population Non-Hispanic Black % by Zip Code (ZCTA5) — California
- Population Non-Hispanic White % by Zip Code (ZCTA5) — California
- Population Hispanic % by Zip Code (ZCTA5) — California
- Median Age by Zip Code (ZCTA5) — California
- % of Population on Food Stamps or SNAP (Last 12 Months), by Zip Code (ZCTA5) — Texas
- Population Non-Hispanic Asian % by Zip Code (ZCTA5) — Texas
- Household Median Income by Zip Code (ZCTA5) — California
- High School Graduate (% of Over 25) by Zip Code (ZCTA5) — California
- Population Non-Hispanic White % by Zip Code (ZCTA5) — Florida
- Housing Median Monthly Rent ($), by Zip Code (ZCTA5) — Alabama
- Housing Owner-Occupied Median Value ($), by Zip Code (ZCTA5) — Alabama
- Housing % of Units Built Since 2010, by Zip Code (ZCTA5) — Alabama
- Household Average Size by Zip Code (ZCTA5) — Alabama
- Married Couple (% of all Households) by Zip Code (ZCTA5) — Alabama
- Population Hispanic % by Zip Code (ZCTA5) — Louisiana
- % of Population without Health Insurance, by Zip Code (ZCTA5) — Alabama
- Housing Vacancy Rate by Zip Code (ZCTA5) — Alabama
- % of Households with Broadband Internet, by Zip Code (ZCTA5) — Alabama
- Housing Owner-Occupied % of Units, by Zip Code (ZCTA5) — Indiana
- Housing Owner-Occupied % of Units, by Zip Code (ZCTA5) — Montana
- Housing Owner-Occupied % of Units, by Zip Code (ZCTA5) — St. Louis Metro
- Housing Owner-Occupied % of Units, by Zip Code (ZCTA5) — Utah
- Housing Owner-Occupied % of Units, by Zip Code (ZCTA5) — Ohio
- Housing Owner-Occupied % of Units, by Zip Code (ZCTA5) — Iowa
- Housing Owner-Occupied % of Units, by Zip Code (ZCTA5) — Arizona
- Housing Owner-Occupied % of Units, by Zip Code (ZCTA5) — Texas
- Housing Owner-Occupied % of Units, by Zip Code (ZCTA5) — Idaho
- Housing Owner-Occupied % of Units, by Zip Code (ZCTA5) — Oregon