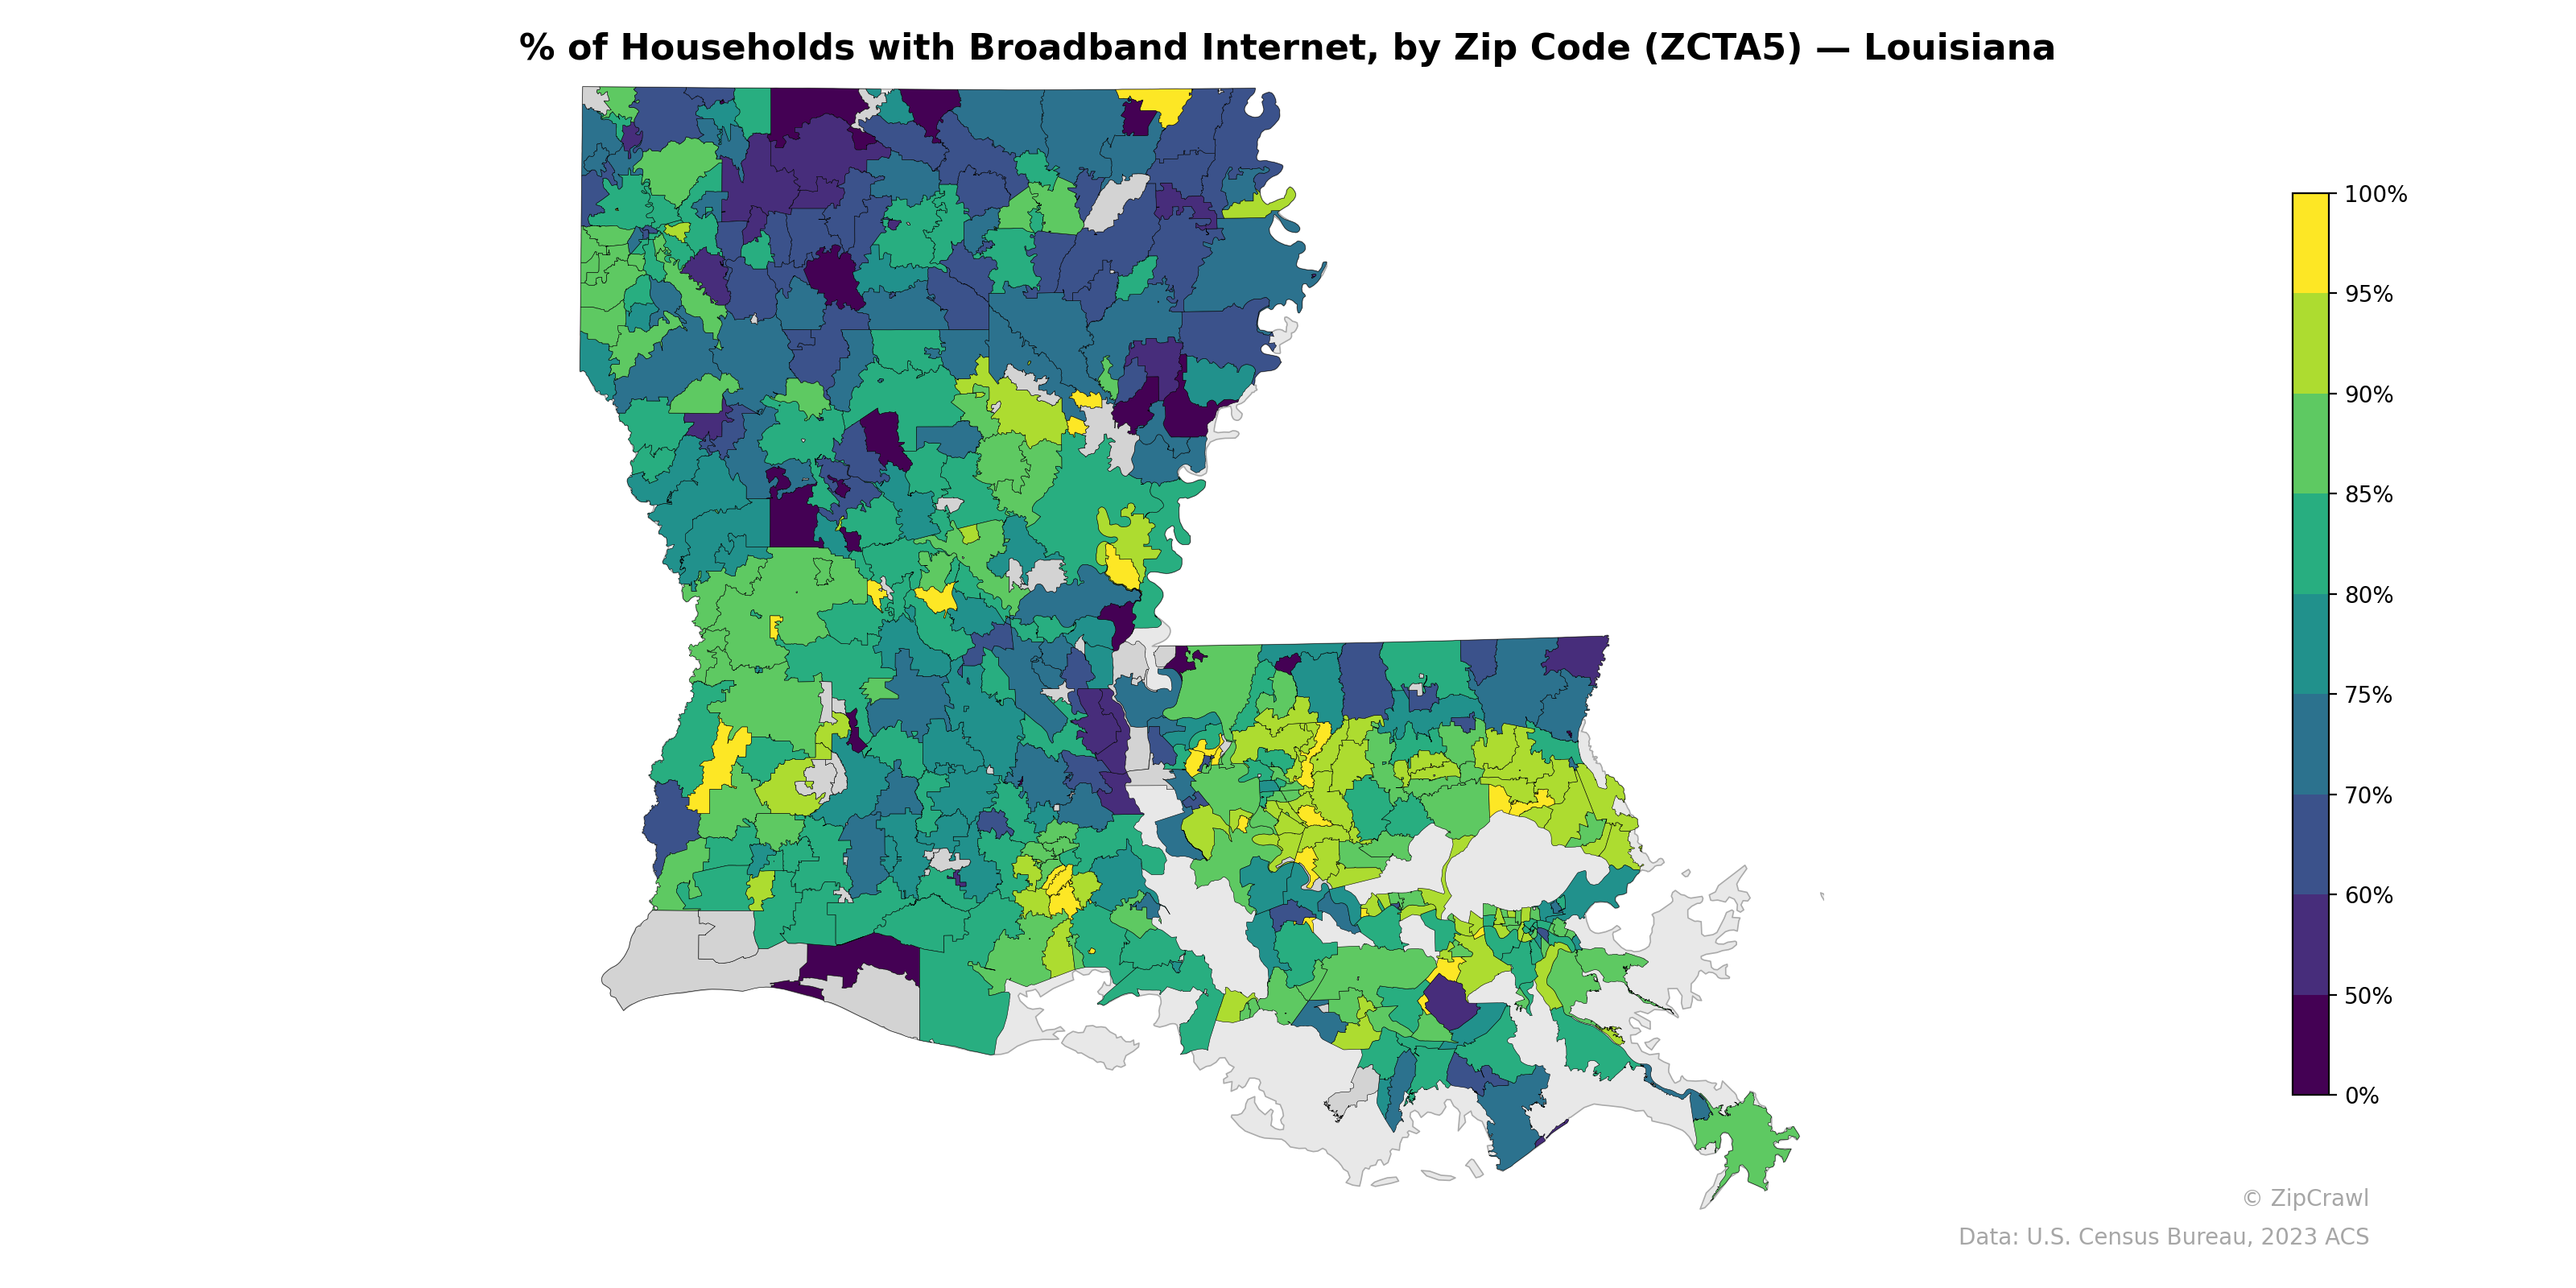
NOTE: Gray indicates insufficient data or a suppressed estimate.
Broadband adoption rates across Louisiana exhibit a pronounced urban-rural divide, with zip codes in the Baton Rouge, New Orleans, and suburban Shreveport areas generally reaching 85–95%+ coverage, while large swaths of the rural northern parishes and Mississippi Delta-adjacent regions in the northeast fall below 65%. Several deep purple pockets indicating sub-50% broadband penetration cluster in economically disadvantaged areas of north-central Louisiana and parts of the southeastern coastal zone. The western parishes display a more moderate and mixed pattern, with scattered high-access zip codes likely corresponding to smaller cities like Lake Charles and Lafayette surrounded by lower-connectivity rural areas.
Data: U.S. Census Bureau, 2023 ACS
Explore
- U.S. Citizens (% of Population Over 18) by Zip Code (ZCTA5) — California
- Housing Owner-Occupied % of Units, by Zip Code (ZCTA5) — Louisiana
- Household Average Size by Zip Code (ZCTA5) — Louisiana
- Population Non-Hispanic American Indian % by Zip Code (ZCTA5) — Louisiana
- Housing Owner-Occupied Median Value ($), by Zip Code (ZCTA5) — Louisiana
- % of Population without Health Insurance, by Zip Code (ZCTA5) — Louisiana
- Bachelor's Degree or Higher (% of Over 25) by Zip Code (ZCTA5) — Louisiana
- Housing % of Units Built Since 2010, by Zip Code (ZCTA5) — Louisiana
- High School Graduate (% of Over 25) by Zip Code (ZCTA5) — Louisiana
- Housing Median Monthly Rent ($), by Zip Code (ZCTA5) — Louisiana
- Household Median Income by Zip Code (ZCTA5) — California
- Population Non-Hispanic American Indian % by Zip Code (ZCTA5) — California
- High School Graduate (% of Over 25) by Zip Code (ZCTA5) — California
- Population Hispanic % by Zip Code (ZCTA5) — California
- Population Non-Hispanic Black % by Zip Code (ZCTA5) — California
- Population Non-Hispanic Asian % by Zip Code (ZCTA5) — Texas
- Median Age by Zip Code (ZCTA5) — California
- % of Population on Food Stamps or SNAP (Last 12 Months), by Zip Code (ZCTA5) — Texas
- Population Non-Hispanic White % by Zip Code (ZCTA5) — California
- Household Median Income by Zip Code (ZCTA5) — Florida
- Housing Median Monthly Rent ($), by Zip Code (ZCTA5) — Alabama
- Housing Owner-Occupied Median Value ($), by Zip Code (ZCTA5) — Alabama
- Housing % of Units Built Since 2010, by Zip Code (ZCTA5) — Alabama
- Household Average Size by Zip Code (ZCTA5) — Alabama
- Married Couple (% of all Households) by Zip Code (ZCTA5) — Alabama
- Population Non-Hispanic Asian % by Zip Code (ZCTA5) — Alabama
- % of Population without Health Insurance, by Zip Code (ZCTA5) — Alabama
- Housing Owner-Occupied % of Units, by Zip Code (ZCTA5) — Alabama
- Housing Vacancy Rate by Zip Code (ZCTA5) — Alabama
- Population Non-Hispanic American Indian % by Zip Code (ZCTA5) — Alabama
- % of Households with Broadband Internet, by Zip Code (ZCTA5) — Indiana
- % of Households with Broadband Internet, by Zip Code (ZCTA5) — Montana
- % of Households with Broadband Internet, by Zip Code (ZCTA5) — St. Louis Metro
- % of Households with Broadband Internet, by Zip Code (ZCTA5) — Ohio
- % of Households with Broadband Internet, by Zip Code (ZCTA5) — Iowa
- % of Households with Broadband Internet, by Zip Code (ZCTA5) — Utah
- % of Households with Broadband Internet, by Zip Code (ZCTA5) — Idaho
- % of Households with Broadband Internet, by Zip Code (ZCTA5) — Arizona
- % of Households with Broadband Internet, by Zip Code (ZCTA5) — Oregon
- % of Households with Broadband Internet, by Zip Code (ZCTA5) — Texas