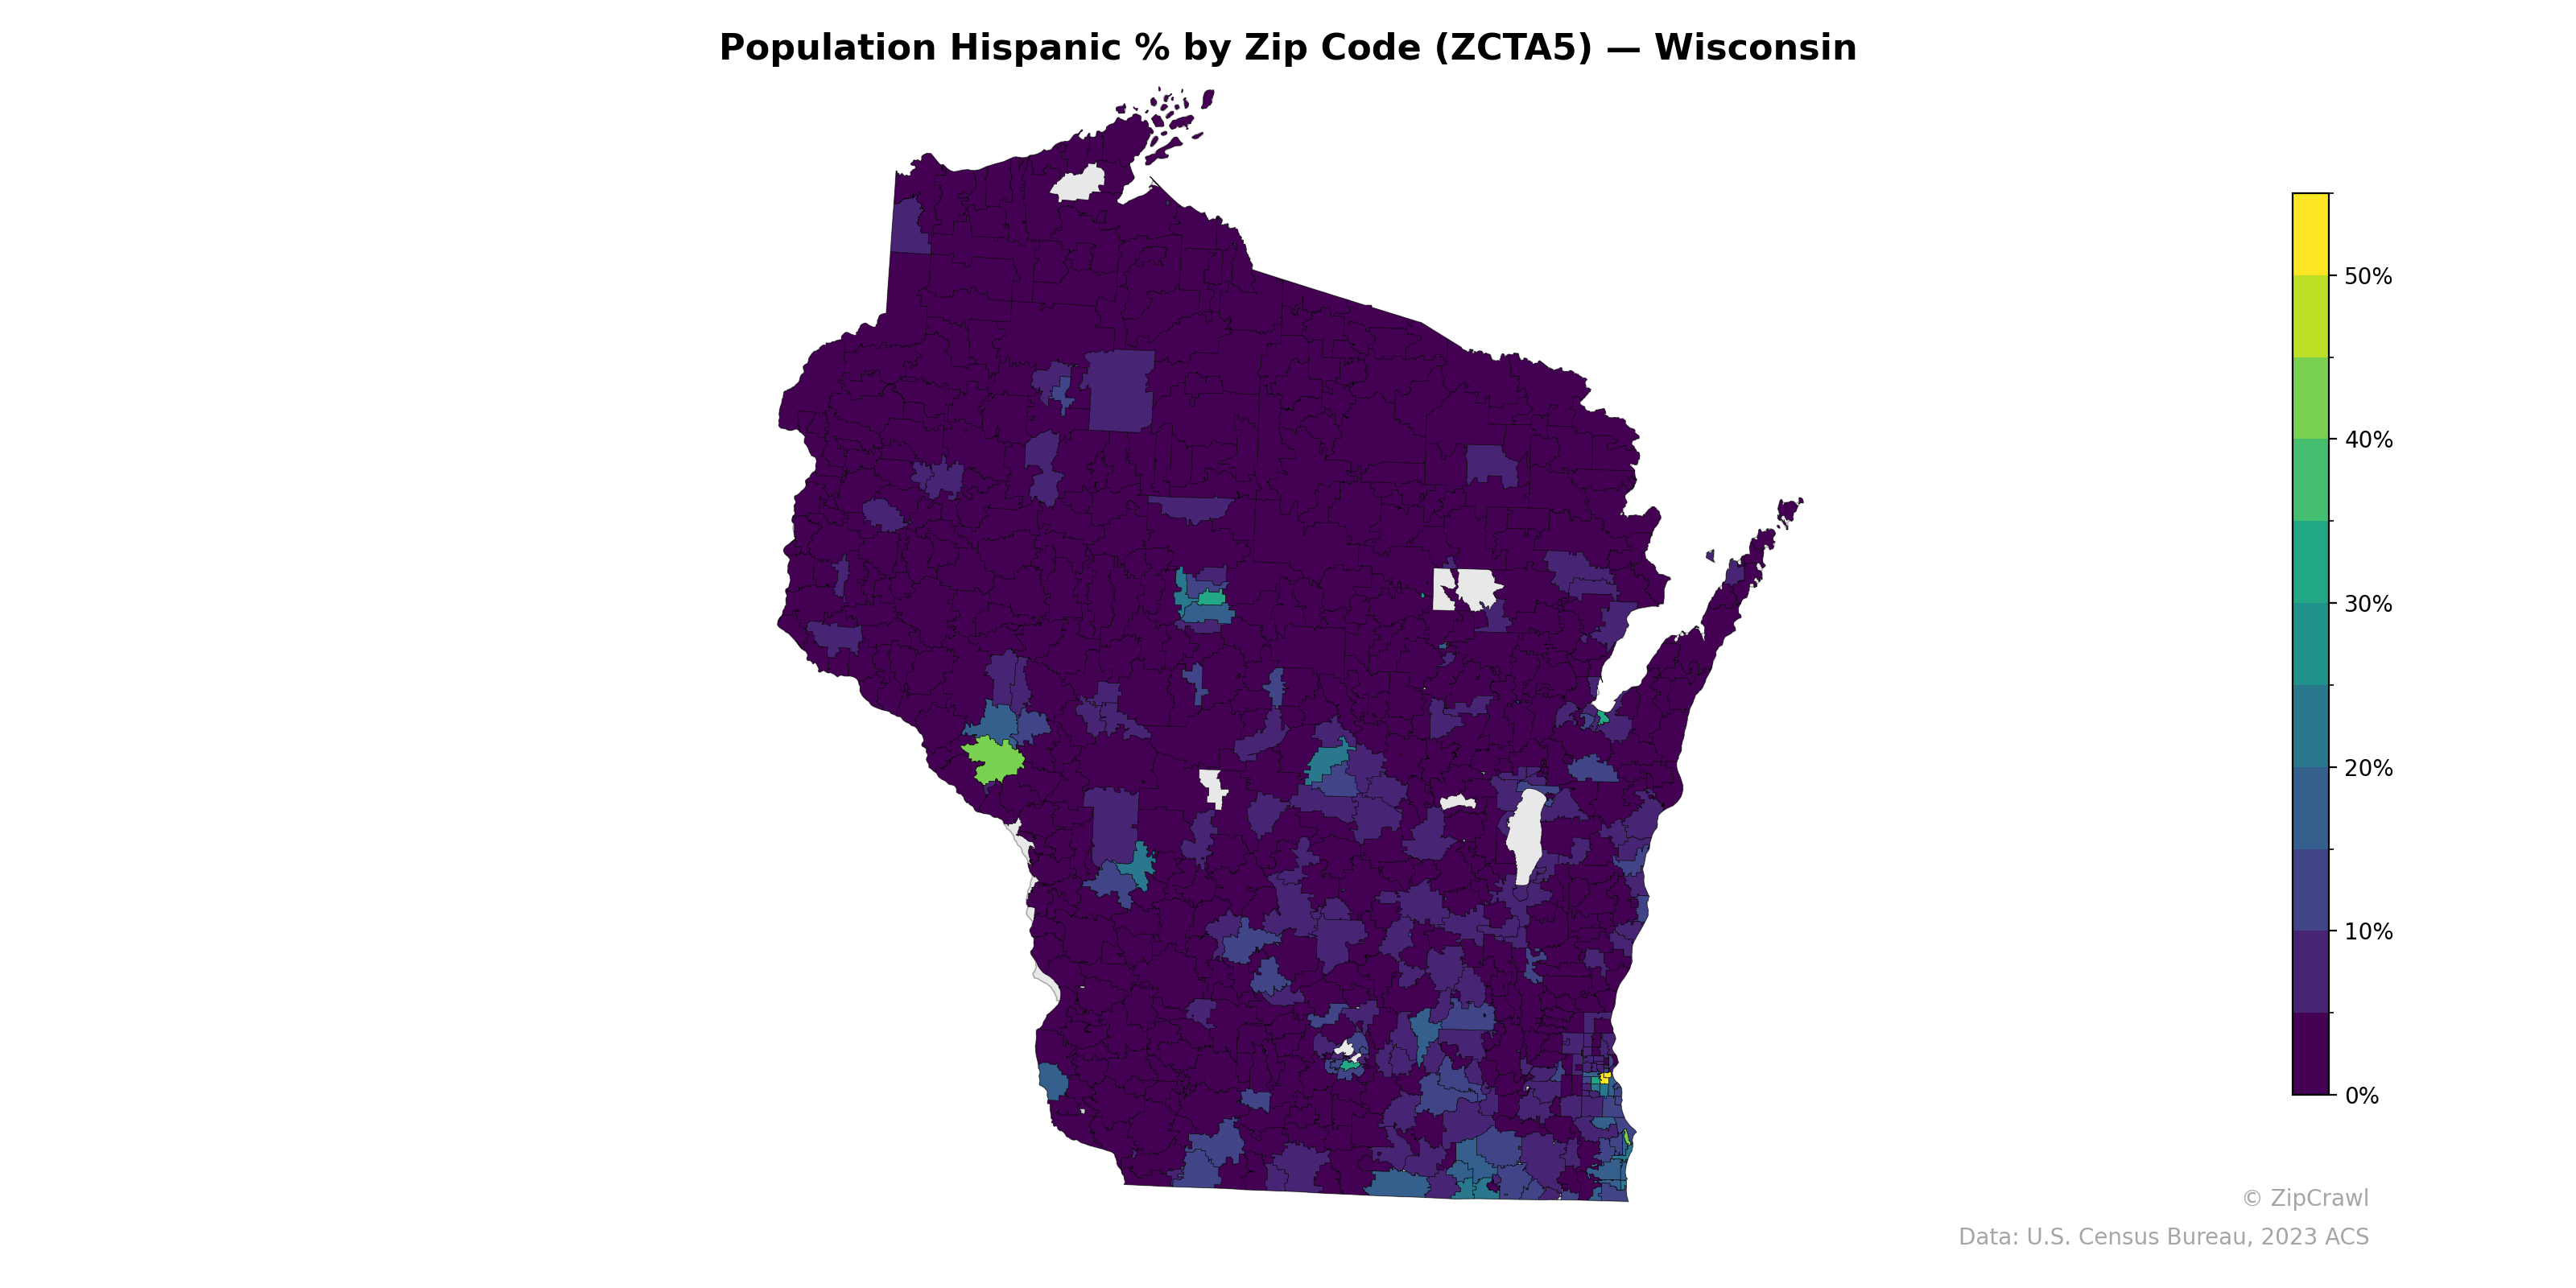
NOTE: Gray indicates insufficient data or a suppressed estimate.
Hispanic population concentration in Wisconsin is highest in the western-central part of the state, where a distinct cluster near the La Crosse–Eau Claire corridor reaches approximately 40–50%, alongside scattered elevated zip codes in the central agricultural regions. The Milwaukee metropolitan area in the southeastern corner displays notable internal variation, with specific zip codes reaching 20–30% or higher adjacent to areas below 5%. The vast majority of northern and rural Wisconsin zip codes remain below 5% Hispanic, creating a stark contrast with the pockets of concentration in urban centers and agricultural communities across the central and southern portions of the state.
Data: U.S. Census Bureau, 2023 ACS
Explore
- Housing Median Monthly Rent ($), by Zip Code (ZCTA5) — Texas
- Population Non-Hispanic White % by Zip Code (ZCTA5) — Wisconsin
- U.S. Citizens (% of Population Over 18) by Zip Code (ZCTA5) — Wisconsin
- Married Couple (% of all Households) by Zip Code (ZCTA5) — South Carolina
- Household Median Income by Zip Code (ZCTA5) — Wisconsin
- Population Non-Hispanic Black % by Zip Code (ZCTA5) — Wisconsin
- Housing Vacancy Rate by Zip Code (ZCTA5) — South Carolina
- Median Age by Zip Code (ZCTA5) — Wisconsin
- Population Non-Hispanic Asian % by Zip Code (ZCTA5) — South Carolina
- % of Population on Food Stamps or SNAP (Last 12 Months), by Zip Code (ZCTA5) — South Carolina
- Bachelor's Degree or Higher (% of Over 25) by County
- Married Couple (% of all Households) by Zip Code (ZCTA5) — Texas
- Household Average Size by Zip Code (ZCTA5) — Texas
- Housing Owner-Occupied % of Units, by Zip Code (ZCTA5) — Texas
- Housing % of Units Built Since 2010, by Zip Code (ZCTA5) — Texas
- Housing Owner-Occupied Median Value ($), by Zip Code (ZCTA5) — Texas
- Housing Vacancy Rate by Zip Code (ZCTA5) — Texas
- Married Couple (% of all Households) by Zip Code (ZCTA5) — Los Angeles Metro
- % of Households with Broadband Internet, by Zip Code (ZCTA5) — Texas
- % of Population without Health Insurance, by Zip Code (ZCTA5) — Texas
- Bachelor's Degree or Higher (% of Over 25) by Zip Code (ZCTA5) — Texas
- Bachelor's Degree or Higher (% of Over 25) by Zip Code (ZCTA5) — Wisconsin
- % of Population on Food Stamps or SNAP (Last 12 Months), by Zip Code (ZCTA5) — Wisconsin
- High School Graduate (% of Over 25) by Zip Code (ZCTA5) — Wisconsin
- Population Non-Hispanic American Indian % by Zip Code (ZCTA5) — Wisconsin
- U.S. Citizens (% of Population Over 18) by Zip Code (ZCTA5) — Colorado
- Married Couple (% of all Households) by Zip Code (ZCTA5) — Wisconsin
- Household Average Size by Zip Code (ZCTA5) — Wisconsin
- Housing Vacancy Rate by Zip Code (ZCTA5) — Wisconsin
- Housing % of Units Built Since 2010, by Zip Code (ZCTA5) — Wisconsin
- Population Hispanic % by Zip Code (ZCTA5) — Iowa
- Population Hispanic % by Zip Code (ZCTA5) — Ohio
- Population Hispanic % by Zip Code (ZCTA5) — Utah
- Population Hispanic % by Zip Code (ZCTA5) — Wyoming
- Population Hispanic % by Zip Code (ZCTA5) — Idaho
- Population Hispanic % by Zip Code (ZCTA5) — Hawaii
- Population Hispanic % by Zip Code (ZCTA5) — Maine
- Population Hispanic % by Zip Code (ZCTA5) — Texas
- Population Hispanic % by Zip Code (ZCTA5) — Oregon
- Population Hispanic % by Zip Code (ZCTA5) — Colorado