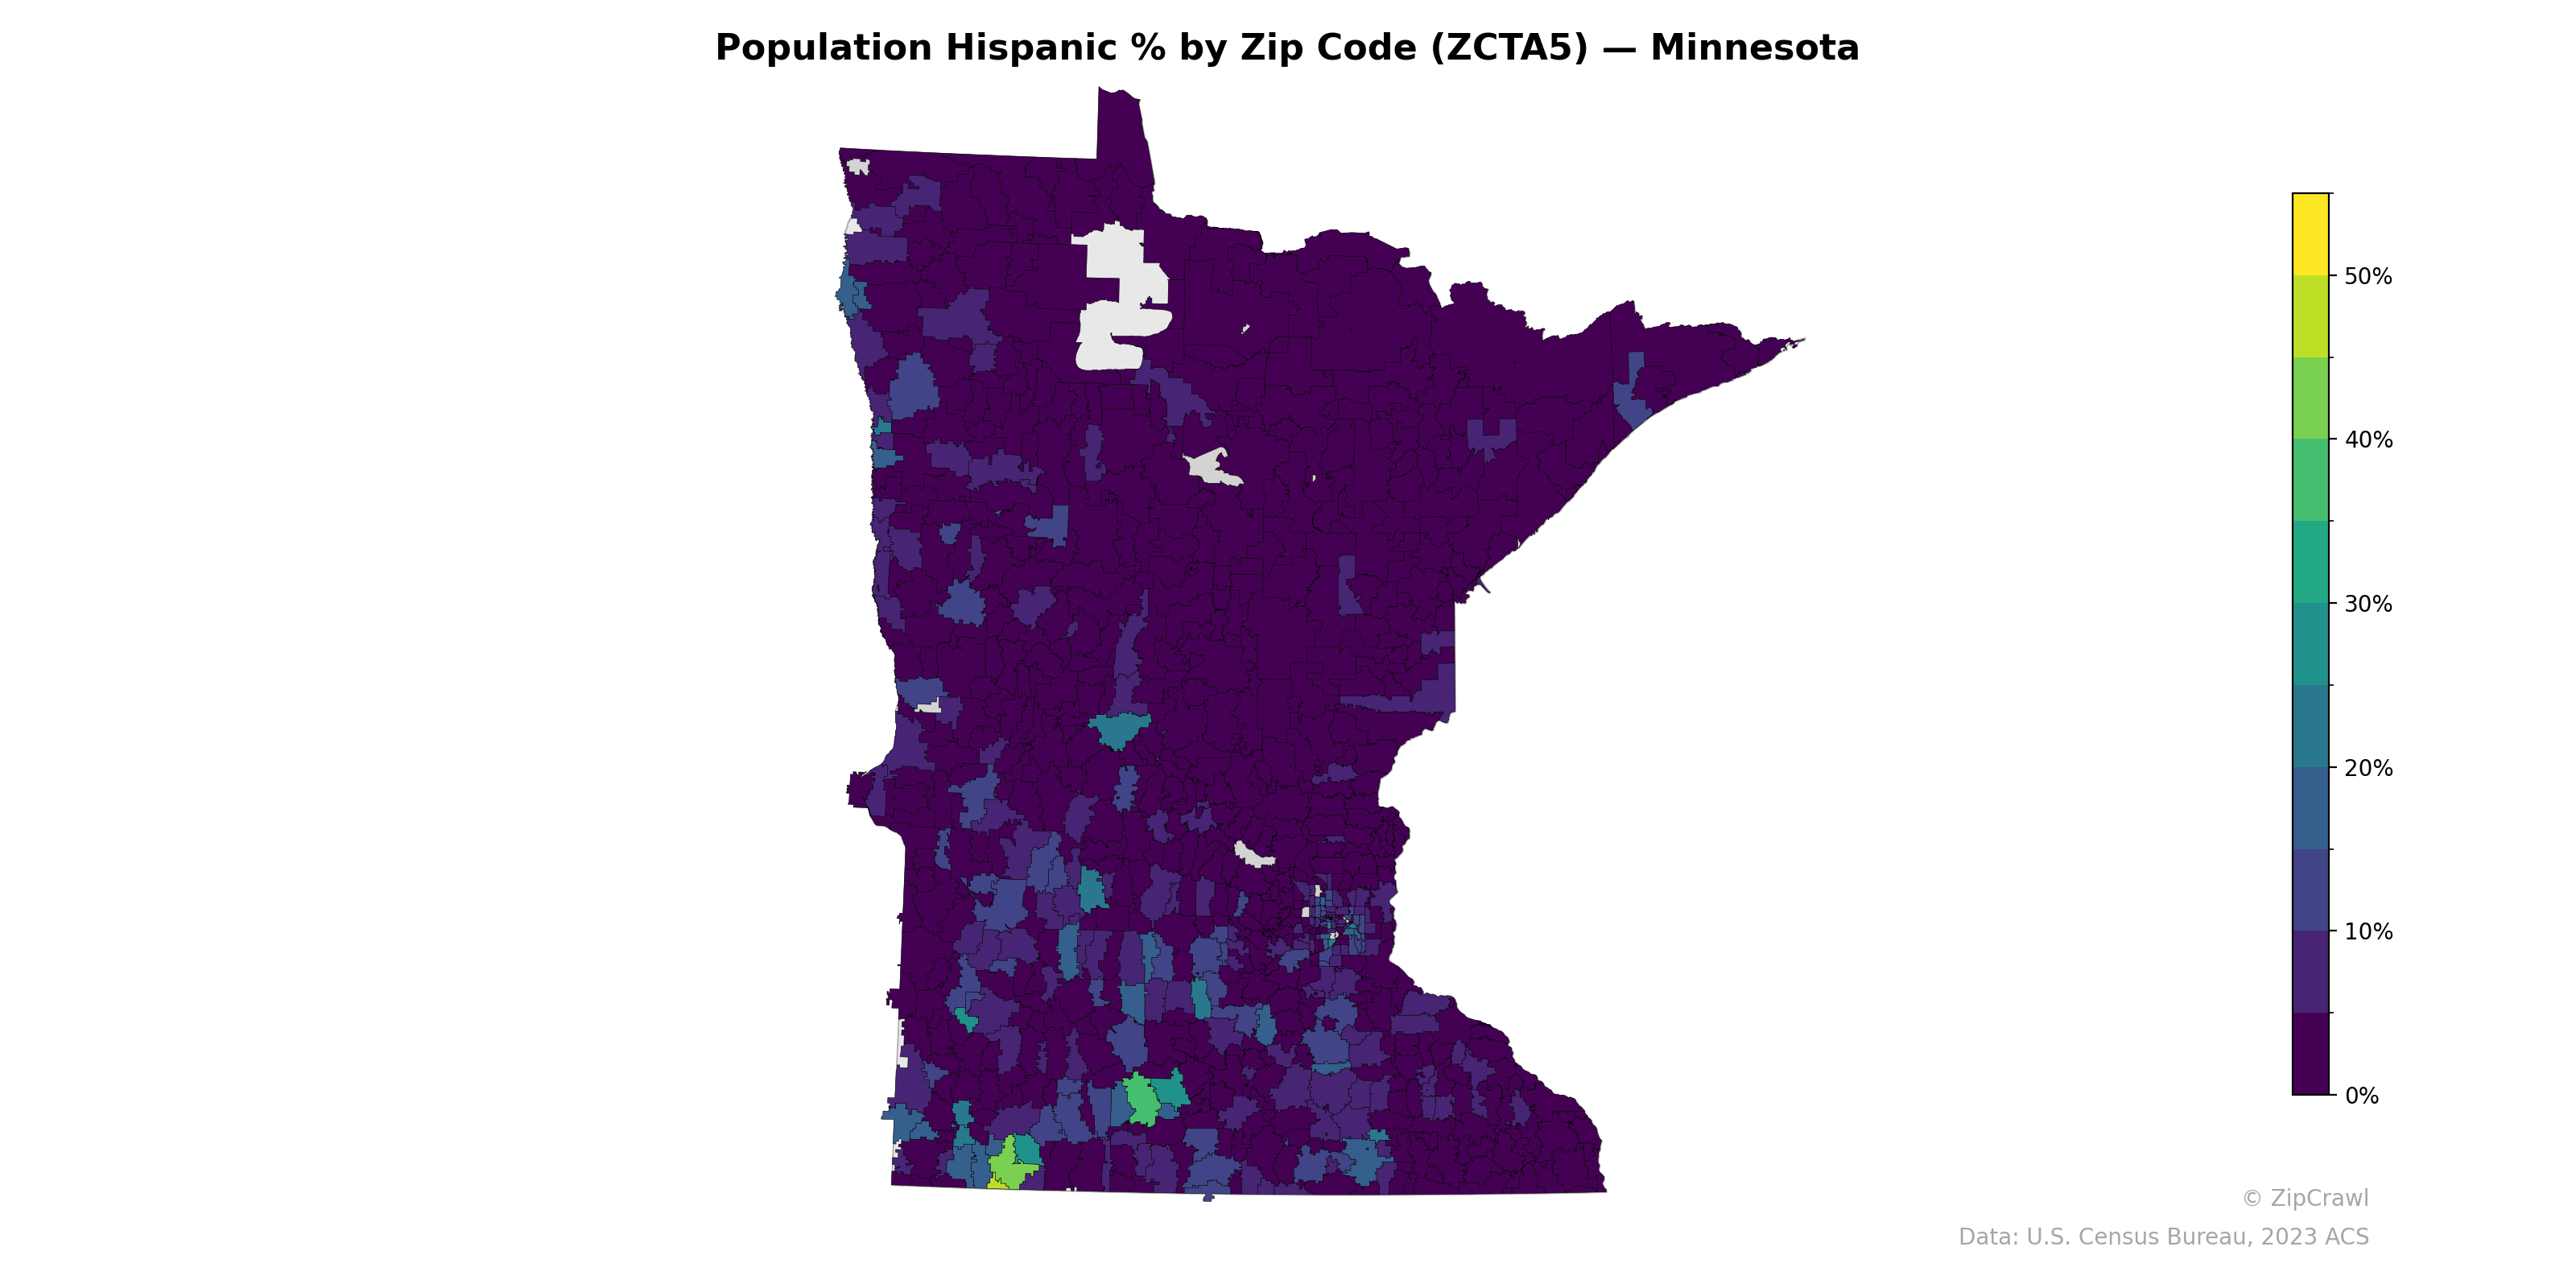
NOTE: Gray indicates insufficient data or a suppressed estimate.
Hispanic population concentrations in Minnesota are most pronounced in the southern tier of the state, particularly in a cluster of zip codes near the Iowa border where percentages reach 40–55%, likely corresponding to meatpacking and agricultural communities such as Worthington and St. James. A secondary band of moderate Hispanic representation (10–25%) appears in parts of the central-west region, including areas around Willmar, as well as scattered zip codes in the Twin Cities metro. The vast majority of northern and northeastern Minnesota zip codes remain below 5%, creating a stark north-south gradient across the state.
Data: U.S. Census Bureau, 2023 ACS
Explore
- % of Households with Broadband Internet, by Zip Code (ZCTA5) — Texas
- U.S. Citizens (% of Population Over 18) by Zip Code (ZCTA5) — Minnesota
- % of Population on Food Stamps or SNAP (Last 12 Months), by Zip Code (ZCTA5) — Colorado
- Population Non-Hispanic Black % by Zip Code (ZCTA5) — Minnesota
- Population Non-Hispanic Asian % by Zip Code (ZCTA5) — Colorado
- Population Non-Hispanic White % by Zip Code (ZCTA5) — Minnesota
- Household Median Income by Zip Code (ZCTA5) — Minnesota
- Median Age by Zip Code (ZCTA5) — Minnesota
- Housing Vacancy Rate by Zip Code (ZCTA5) — Colorado
- Married Couple (% of all Households) by Zip Code (ZCTA5) — Colorado
- Bachelor's Degree or Higher (% of Over 25) by County
- Married Couple (% of all Households) by Zip Code (ZCTA5) — Texas
- % of Population without Health Insurance, by Zip Code (ZCTA5) — Texas
- Housing Owner-Occupied Median Value ($), by Zip Code (ZCTA5) — Texas
- Housing Owner-Occupied % of Units, by Zip Code (ZCTA5) — Texas
- Housing Vacancy Rate by Zip Code (ZCTA5) — Texas
- Housing % of Units Built Since 2010, by Zip Code (ZCTA5) — Texas
- Housing Median Monthly Rent ($), by Zip Code (ZCTA5) — Texas
- Bachelor's Degree or Higher (% of Over 25) by Zip Code (ZCTA5) — Texas
- Housing % of Units Built Since 2010, by County
- Household Average Size by Zip Code (ZCTA5) — Texas
- Bachelor's Degree or Higher (% of Over 25) by Zip Code (ZCTA5) — Wisconsin
- Population Non-Hispanic American Indian % by Zip Code (ZCTA5) — Wisconsin
- Population Non-Hispanic Black % by Zip Code (ZCTA5) — Wisconsin
- Population Non-Hispanic White % by Zip Code (ZCTA5) — Wisconsin
- High School Graduate (% of Over 25) by Zip Code (ZCTA5) — Wisconsin
- % of Population on Food Stamps or SNAP (Last 12 Months), by Zip Code (ZCTA5) — Wisconsin
- Household Average Size by Zip Code (ZCTA5) — Wisconsin
- Married Couple (% of all Households) by Zip Code (ZCTA5) — Wisconsin
- Median Age by Zip Code (ZCTA5) — Wisconsin
- Population Hispanic % by Zip Code (ZCTA5) — Maine
- Population Hispanic % by Zip Code (ZCTA5) — Missouri
- Population Hispanic % by Zip Code (ZCTA5) — Michigan
- Population Hispanic % by Zip Code (ZCTA5) — Minneapolis Metro
- Population Hispanic % by Zip Code (ZCTA5) — Ohio
- Population Hispanic % by Zip Code (ZCTA5) — Iowa
- Population Hispanic % by Zip Code (ZCTA5) — Utah
- Population Hispanic % by Zip Code (ZCTA5) — Mississippi
- Population Hispanic % by Zip Code (ZCTA5) — Tennessee
- Population Hispanic % by Zip Code (ZCTA5) — Montana