NOTE: Gray indicates insufficient data or a suppressed estimate.
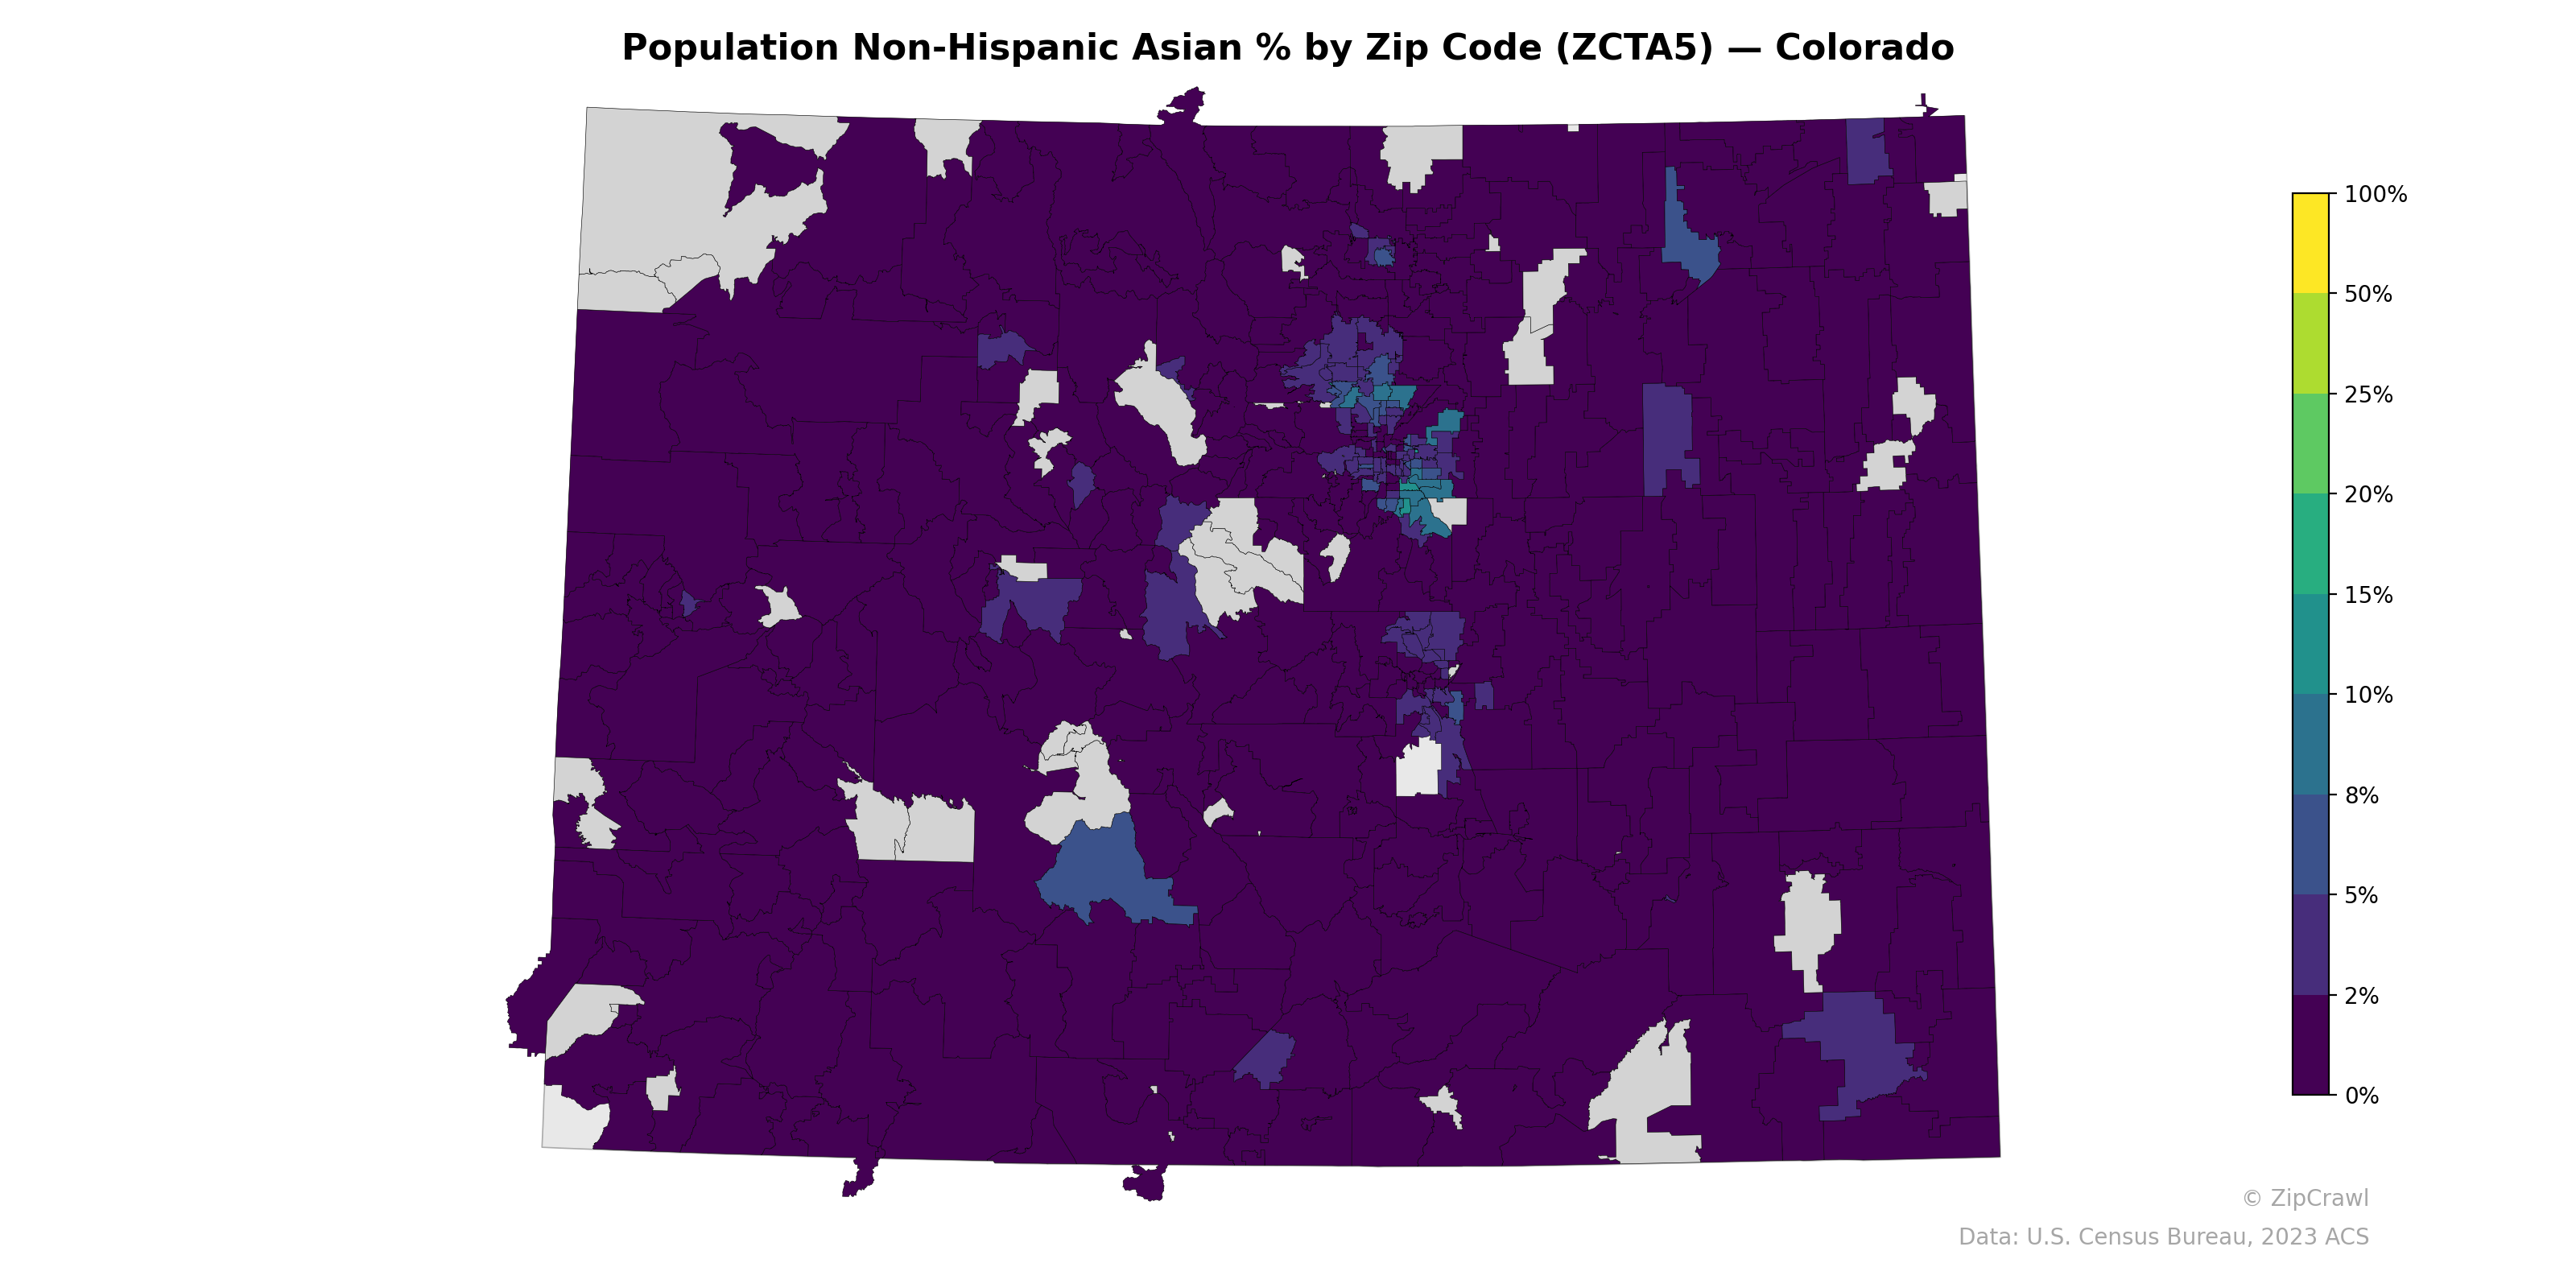
The Denver-Aurora metropolitan area stands out as the primary concentration of Non-Hispanic Asian population in Colorado, with several zip codes in the central metro cluster reaching 8–15% or higher, likely corresponding to neighborhoods in Aurora, Centennial, and parts of Denver proper. A secondary but notably smaller concentration appears in the Colorado Springs area and select mountain-corridor zip codes, while the vast majority of the state—particularly the Eastern Plains and Western Slope—registers at or near 0–2%. The sharp urban-rural divide underscores that Colorado's Asian population is overwhelmingly concentrated in Front Range suburban and urban zip codes, with minimal presence across the state's extensive rural geographies.
Data: U.S. Census Bureau, 2023 ACS
Explore
- % of Households with Broadband Internet, by Zip Code (ZCTA5) — Texas
- Median Age by Zip Code (ZCTA5) — Minnesota
- Population Non-Hispanic White % by Zip Code (ZCTA5) — Minnesota
- Population Non-Hispanic Black % by Zip Code (ZCTA5) — Minnesota
- Housing Vacancy Rate by Zip Code (ZCTA5) — Colorado
- U.S. Citizens (% of Population Over 18) by Zip Code (ZCTA5) — Minnesota
- Household Median Income by Zip Code (ZCTA5) — Minnesota
- Married Couple (% of all Households) by Zip Code (ZCTA5) — Colorado
- Population Hispanic % by Zip Code (ZCTA5) — Minnesota
- % of Population on Food Stamps or SNAP (Last 12 Months), by Zip Code (ZCTA5) — Colorado
- Bachelor's Degree or Higher (% of Over 25) by County
- Housing Owner-Occupied % of Units, by Zip Code (ZCTA5) — Texas
- Housing Owner-Occupied Median Value ($), by County
- Housing Owner-Occupied Median Value ($), by Zip Code (ZCTA5) — Texas
- Housing Vacancy Rate by Zip Code (ZCTA5) — Texas
- Household Average Size by Zip Code (ZCTA5) — Texas
- Housing % of Units Built Since 2010, by Zip Code (ZCTA5) — Texas
- Housing Median Monthly Rent ($), by Zip Code (ZCTA5) — Texas
- Bachelor's Degree or Higher (% of Over 25) by Zip Code (ZCTA5) — Texas
- % of Population without Health Insurance, by Zip Code (ZCTA5) — Texas
- Married Couple (% of all Households) by Zip Code (ZCTA5) — Texas
- Bachelor's Degree or Higher (% of Over 25) by Zip Code (ZCTA5) — Wisconsin
- High School Graduate (% of Over 25) by Zip Code (ZCTA5) — Wisconsin
- Population Non-Hispanic American Indian % by Zip Code (ZCTA5) — Wisconsin
- Population Non-Hispanic Black % by Zip Code (ZCTA5) — Wisconsin
- Population Non-Hispanic White % by Zip Code (ZCTA5) — Wisconsin
- % of Population on Food Stamps or SNAP (Last 12 Months), by Zip Code (ZCTA5) — Wisconsin
- Household Average Size by Zip Code (ZCTA5) — Wisconsin
- Median Age by Zip Code (ZCTA5) — Wisconsin
- Married Couple (% of all Households) by Zip Code (ZCTA5) — Wisconsin
- Population Non-Hispanic Asian % by Zip Code (ZCTA5) — Utah
- Population Non-Hispanic Asian % by Zip Code (ZCTA5) — Ohio
- Population Non-Hispanic Asian % by Zip Code (ZCTA5) — Iowa
- Population Non-Hispanic Asian % by Zip Code (ZCTA5) — Florida
- Population Non-Hispanic Asian % by Zip Code (ZCTA5) — Texas
- Population Non-Hispanic Asian % by Zip Code (ZCTA5) — Idaho
- Population Non-Hispanic Asian % by Zip Code (ZCTA5) — Hawaii
- Population Non-Hispanic Asian % by Zip Code (ZCTA5) — Oregon
- Population Non-Hispanic Asian % by Zip Code (ZCTA5) — Nevada
- Population Non-Hispanic Asian % by Zip Code (ZCTA5) — Maine