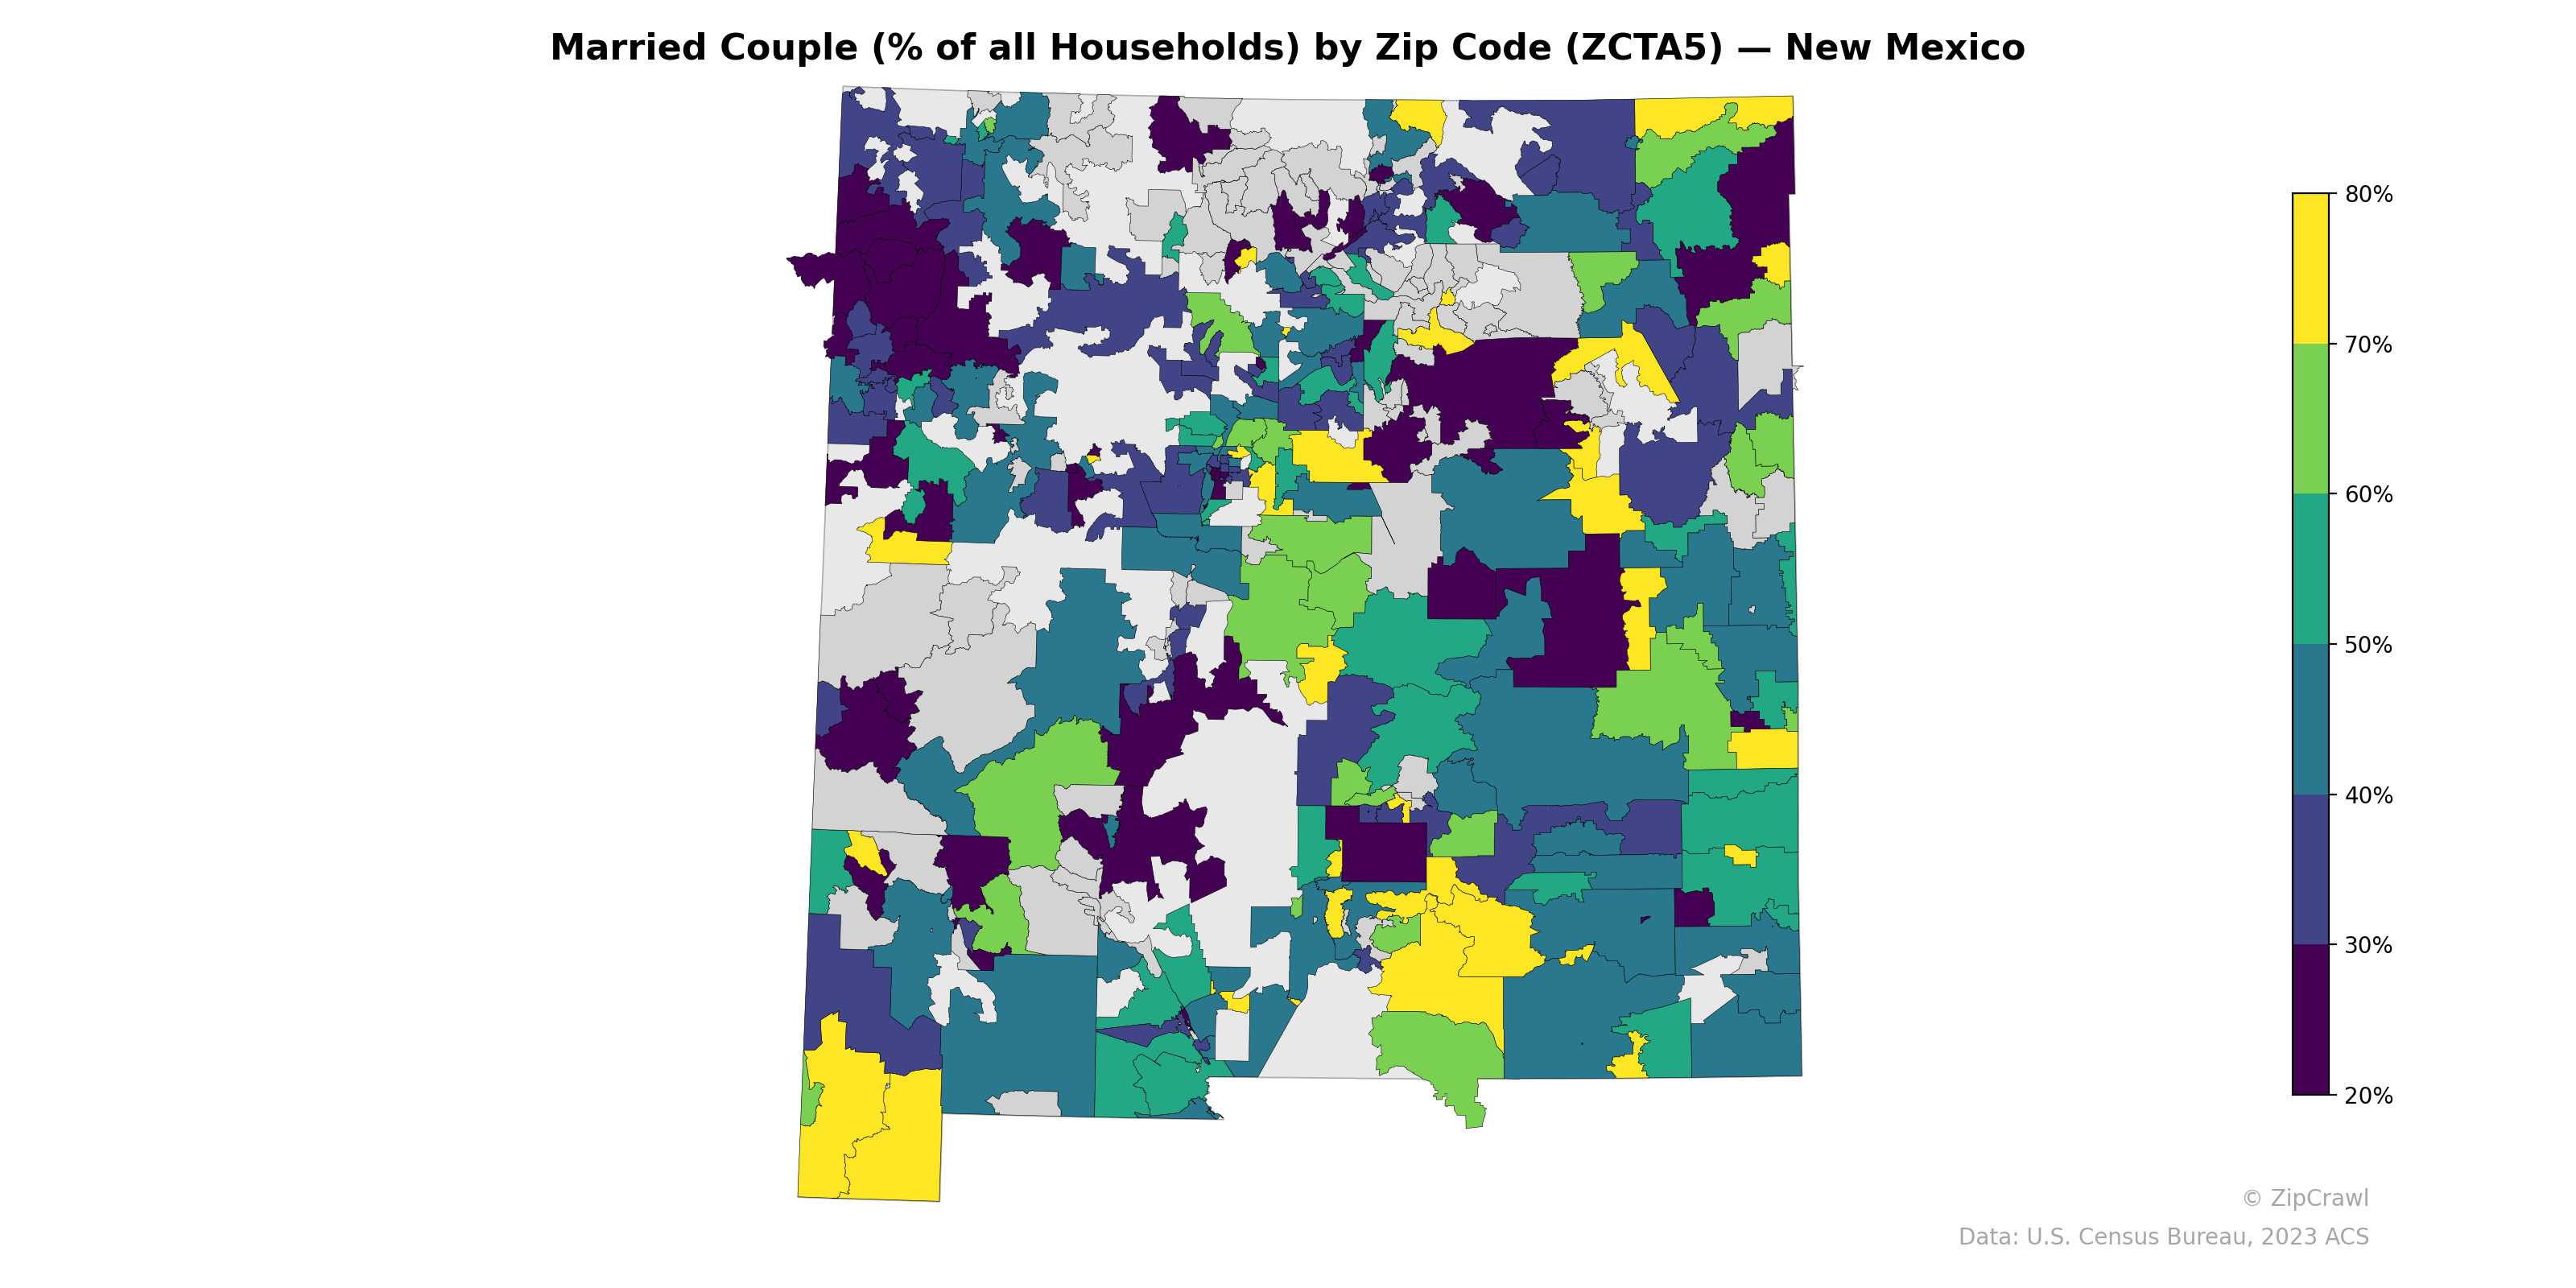
NOTE: Gray indicates insufficient data or a suppressed estimate.
Zip codes in the northwestern quadrant of New Mexico—particularly across the Navajo Nation and surrounding tribal lands—display some of the lowest married-couple household rates, frequently falling below 30%, while rural and suburban zip codes along the eastern border and in the southern Rio Grande corridor tend to cluster in the 50–70% range. The Albuquerque metro area exhibits sharp internal variation, with core urban zip codes in the 30–40% range contrasting with outer suburban areas exceeding 60%. Several small, isolated zip codes in the southeast and along the southern border reach the highest values on the scale (above 75%), likely reflecting tight-knit rural and agricultural communities with older demographic profiles.
Data: U.S. Census Bureau, 2023 ACS
Explore
- Housing Median Monthly Rent ($), by Zip Code (ZCTA5) — Florida
- Population Non-Hispanic Black % by Zip Code (ZCTA5) — Nebraska
- U.S. Citizens (% of Population Over 18) by Zip Code (ZCTA5) — Nebraska
- Housing Vacancy Rate by Zip Code (ZCTA5) — New Mexico
- Population Non-Hispanic White % by Zip Code (ZCTA5) — Nebraska
- Population Hispanic % by Zip Code (ZCTA5) — Nebraska
- Median Age by Zip Code (ZCTA5) — Nebraska
- Household Median Income by Zip Code (ZCTA5) — Nebraska
- Population Non-Hispanic Asian % by Zip Code (ZCTA5) — New Mexico
- % of Population on Food Stamps or SNAP (Last 12 Months), by Zip Code (ZCTA5) — New Mexico
- Housing Median Monthly Rent ($), by County
- Bachelor's Degree or Higher (% of Over 25) by Zip Code (ZCTA5) — New Jersey
- Bachelor's Degree or Higher (% of Over 25) by Zip Code (ZCTA5) — New York
- Housing % of Units Built Since 2010, by Zip Code (ZCTA5) — Florida
- Housing Owner-Occupied Median Value ($), by Zip Code (ZCTA5) — Florida
- Household Average Size by Zip Code (ZCTA5) — Florida
- Bachelor's Degree or Higher (% of Over 25) by Zip Code (ZCTA5) — Florida
- % of Households with Broadband Internet, by Zip Code (ZCTA5) — Florida
- % of Population without Health Insurance, by Zip Code (ZCTA5) — Florida
- Housing Owner-Occupied % of Units, by Zip Code (ZCTA5) — Florida
- Housing Vacancy Rate by Zip Code (ZCTA5) — Florida
- % of Population on Food Stamps or SNAP (Last 12 Months), by Zip Code (ZCTA5) — Mississippi
- % of Population without Health Insurance, by Zip Code (ZCTA5) — Mississippi
- U.S. Citizens (% of Population Over 18) by Zip Code (ZCTA5) — Kansas
- Housing Owner-Occupied % of Units, by Zip Code (ZCTA5) — Mississippi
- Median Age by Zip Code (ZCTA5) — Idaho
- Bachelor's Degree or Higher (% of Over 25) by Zip Code (ZCTA5) — Mississippi
- High School Graduate (% of Over 25) by Zip Code (ZCTA5) — Mississippi
- % of Households with Broadband Internet, by Zip Code (ZCTA5) — Mississippi
- Population Non-Hispanic American Indian % by Zip Code (ZCTA5) — Mississippi
- Married Couple (% of all Households) by Zip Code (ZCTA5) — New York
- Married Couple (% of all Households) by Zip Code (ZCTA5) — New Jersey
- Married Couple (% of all Households) by Zip Code (ZCTA5) — Nevada
- Married Couple (% of all Households) by Zip Code (ZCTA5) — New York Metro
- Married Couple (% of all Households) by Zip Code (ZCTA5) — New Hampshire
- Married Couple (% of all Households) by Zip Code (ZCTA5) — Maine
- Married Couple (% of all Households) by Zip Code (ZCTA5) — Ohio
- Married Couple (% of all Households) by Zip Code (ZCTA5) — Nebraska
- Married Couple (% of all Households) by Zip Code (ZCTA5) — Utah
- Married Couple (% of all Households) by Zip Code (ZCTA5) — Iowa