NOTE: Gray indicates insufficient data or a suppressed estimate.
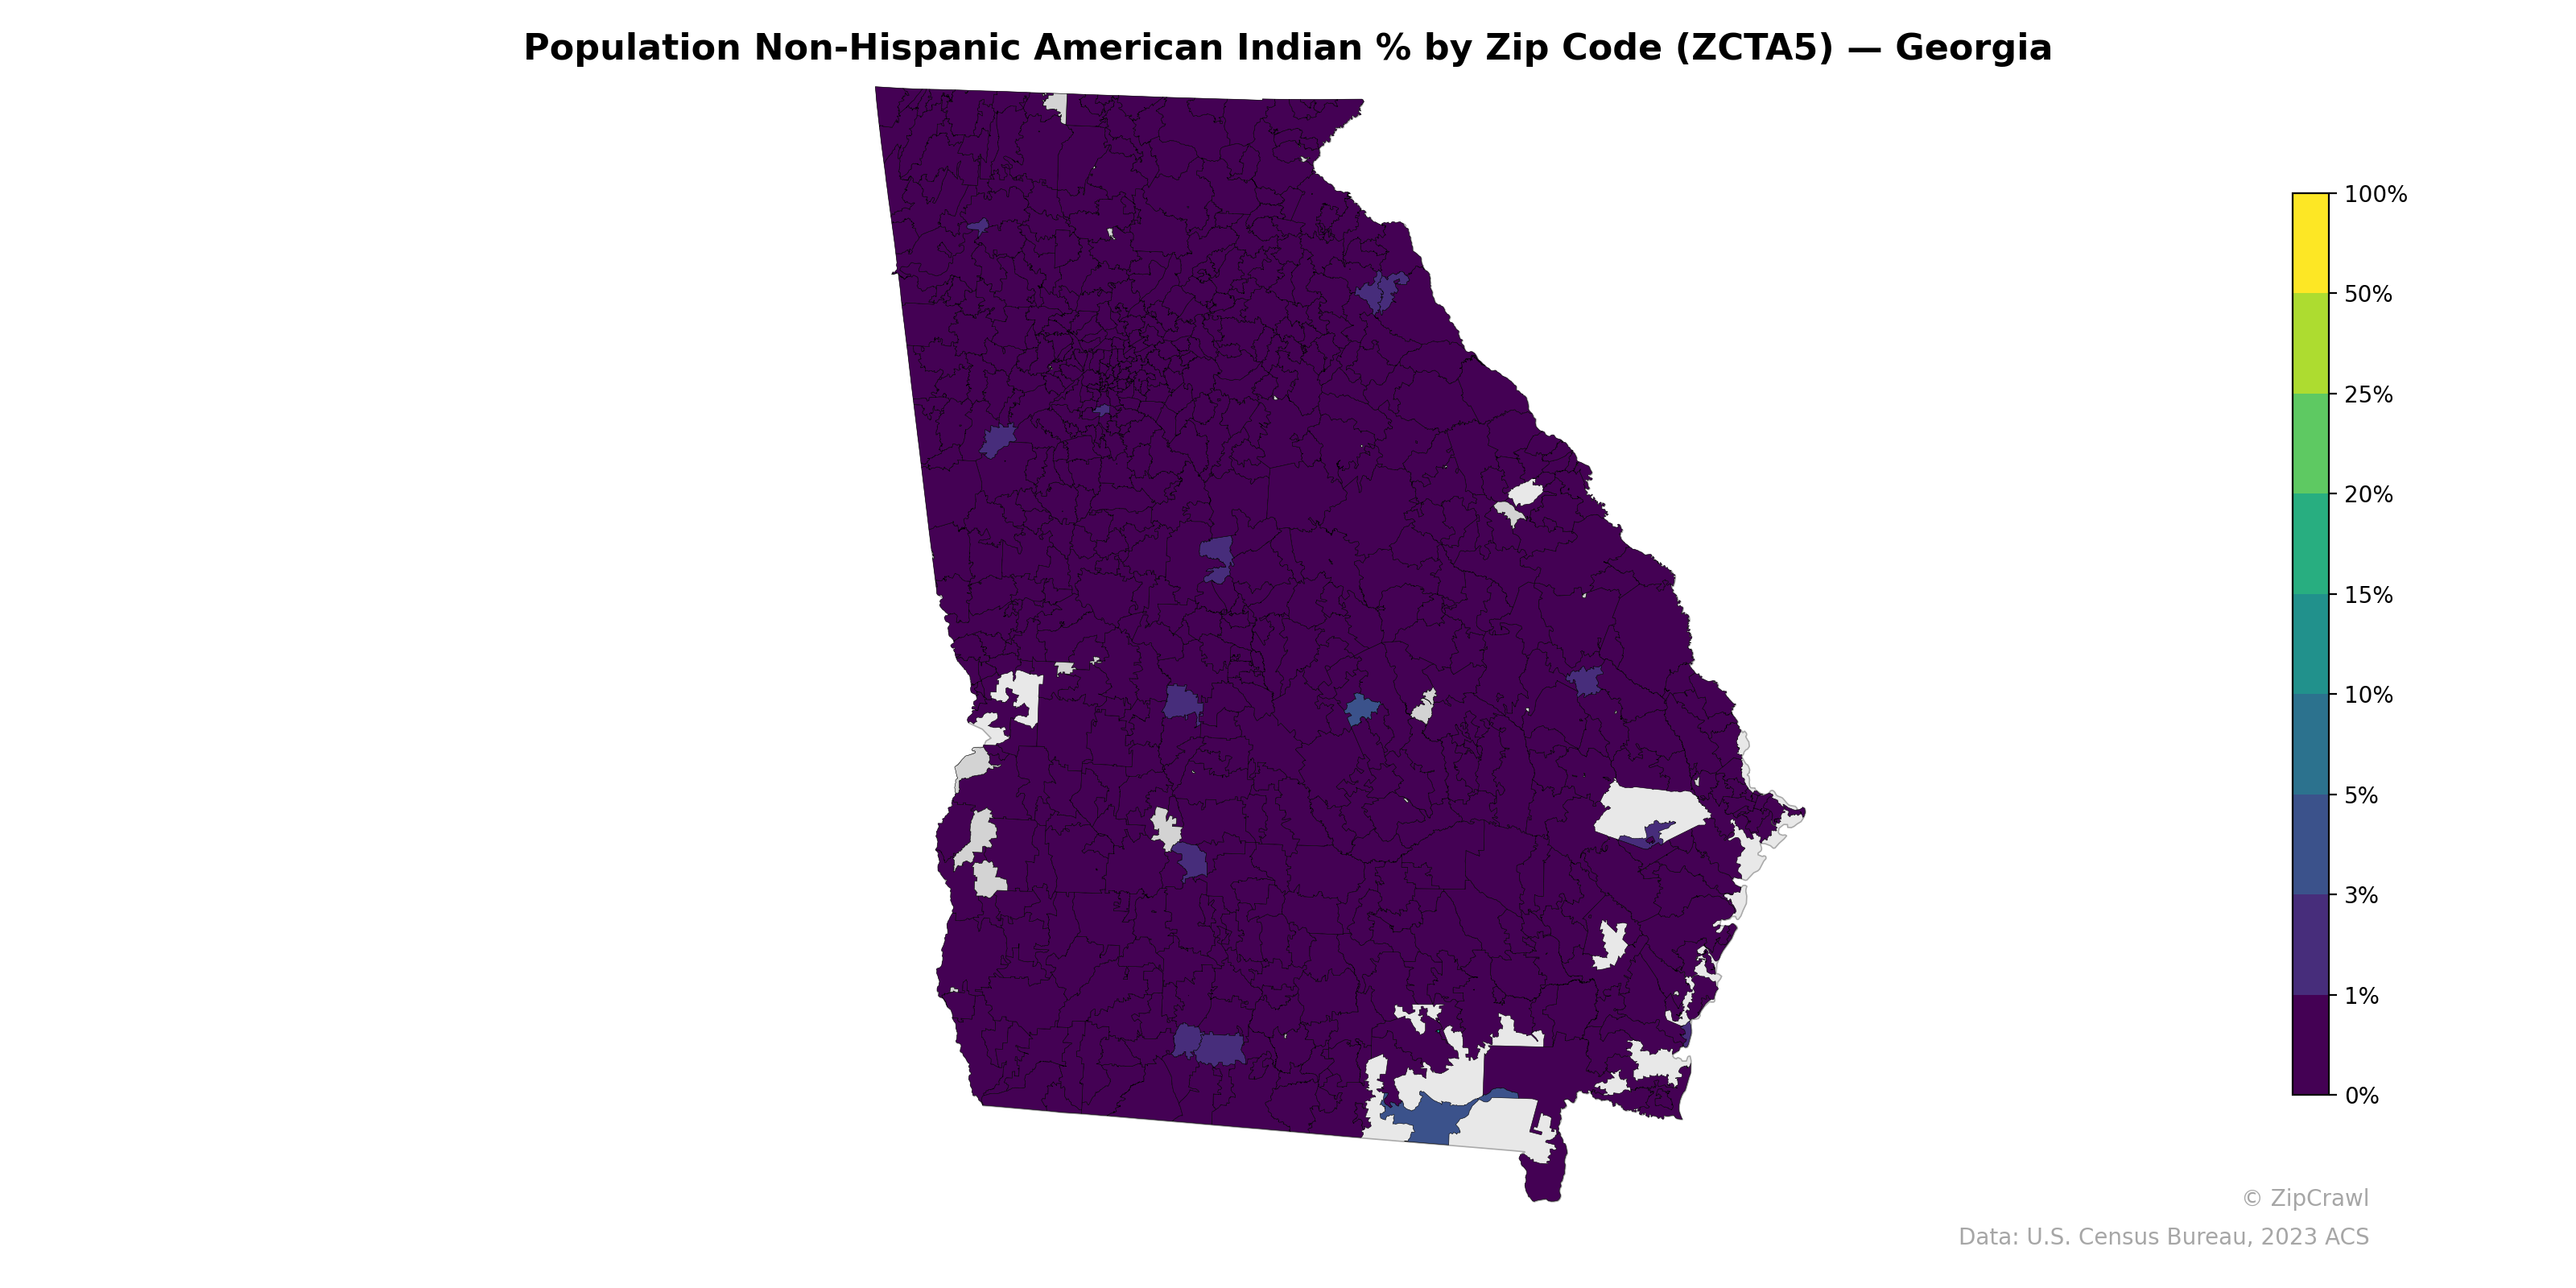
Non-Hispanic American Indian populations across Georgia's zip codes are overwhelmingly below 1%, with the vast majority of the state displaying uniformly low percentages in the darkest purple shading. A few scattered zip codes in central and south-central Georgia show slightly elevated concentrations in the 1–3% range, appearing as lighter-shaded pockets, while a notable cluster near the southeastern coast around the Brunswick/St. Simons area displays comparatively higher percentages. The absence of any zip codes reaching even the mid-range of the color scale underscores that Georgia lacks any significant geographic concentration of Non-Hispanic American Indian population at the ZCTA level.
Data: U.S. Census Bureau, 2023 ACS
Explore
- Household Median Income by Zip Code (ZCTA5) — New York Metro
- High School Graduate (% of Over 25) by Zip Code (ZCTA5) — New York Metro
- % of Population on Food Stamps or SNAP (Last 12 Months), by Zip Code (ZCTA5) — Ohio
- Population Non-Hispanic White % by Zip Code (ZCTA5) — Georgia
- Population Non-Hispanic Black % by Zip Code (ZCTA5) — Georgia
- U.S. Citizens (% of Population Over 18) by Zip Code (ZCTA5) — Georgia
- Median Age by Zip Code (ZCTA5) — Georgia
- High School Graduate (% of Over 25) by Zip Code (ZCTA5) — Georgia
- Population Non-Hispanic Asian % by Zip Code (ZCTA5) — Ohio
- Household Median Income by Zip Code (ZCTA5) — Georgia
- Population Hispanic % by Zip Code (ZCTA5) — Georgia
- Housing % of Units Built Since 2010, by Zip Code (ZCTA5) — Utah
- Median Age by County
- Bachelor's Degree or Higher (% of Over 25) by Zip Code (ZCTA5) — New York Metro
- U.S. Citizens (% of Population Over 18) by Zip Code (ZCTA5) — New York Metro
- Population Hispanic % by Zip Code (ZCTA5) — New York Metro
- Population Non-Hispanic White % by Zip Code (ZCTA5) — New York Metro
- % of Population on Food Stamps or SNAP (Last 12 Months), by County
- Population Non-Hispanic Black % by Zip Code (ZCTA5) — New York Metro
- Median Age by Zip Code (ZCTA5) — New York Metro
- Housing Median Monthly Rent ($), by Zip Code (ZCTA5) — Ohio
- Housing Owner-Occupied Median Value ($), by Zip Code (ZCTA5) — Ohio
- Housing % of Units Built Since 2010, by Zip Code (ZCTA5) — Ohio
- High School Graduate (% of Over 25) by Zip Code (ZCTA5) — Ohio
- Population Non-Hispanic Black % by Zip Code (ZCTA5) — Ohio
- Bachelor's Degree or Higher (% of Over 25) by Zip Code (ZCTA5) — Ohio
- % of Population without Health Insurance, by Zip Code (ZCTA5) — Ohio
- Housing Owner-Occupied % of Units, by Zip Code (ZCTA5) — Ohio
- Population Non-Hispanic White % by Zip Code (ZCTA5) — Ohio
- Population Hispanic % by Zip Code (ZCTA5) — Ohio
- Population Non-Hispanic American Indian % by Zip Code (ZCTA5) — Indiana
- Population Non-Hispanic American Indian % by Zip Code (ZCTA5) — Iowa
- Population Non-Hispanic American Indian % by Zip Code (ZCTA5) — Virginia
- Population Non-Hispanic American Indian % by Zip Code (ZCTA5) — Idaho
- Population Non-Hispanic American Indian % by Zip Code (ZCTA5) — Utah
- Population Non-Hispanic American Indian % by Zip Code (ZCTA5) — Ohio
- Population Non-Hispanic American Indian % by Zip Code (ZCTA5) — Oregon
- Population Non-Hispanic American Indian % by Zip Code (ZCTA5) — Texas
- Population Non-Hispanic American Indian % by Zip Code (ZCTA5) — Nevada
- Population Non-Hispanic American Indian % by Zip Code (ZCTA5) — Hawaii