NOTE: Gray indicates insufficient data or a suppressed estimate.
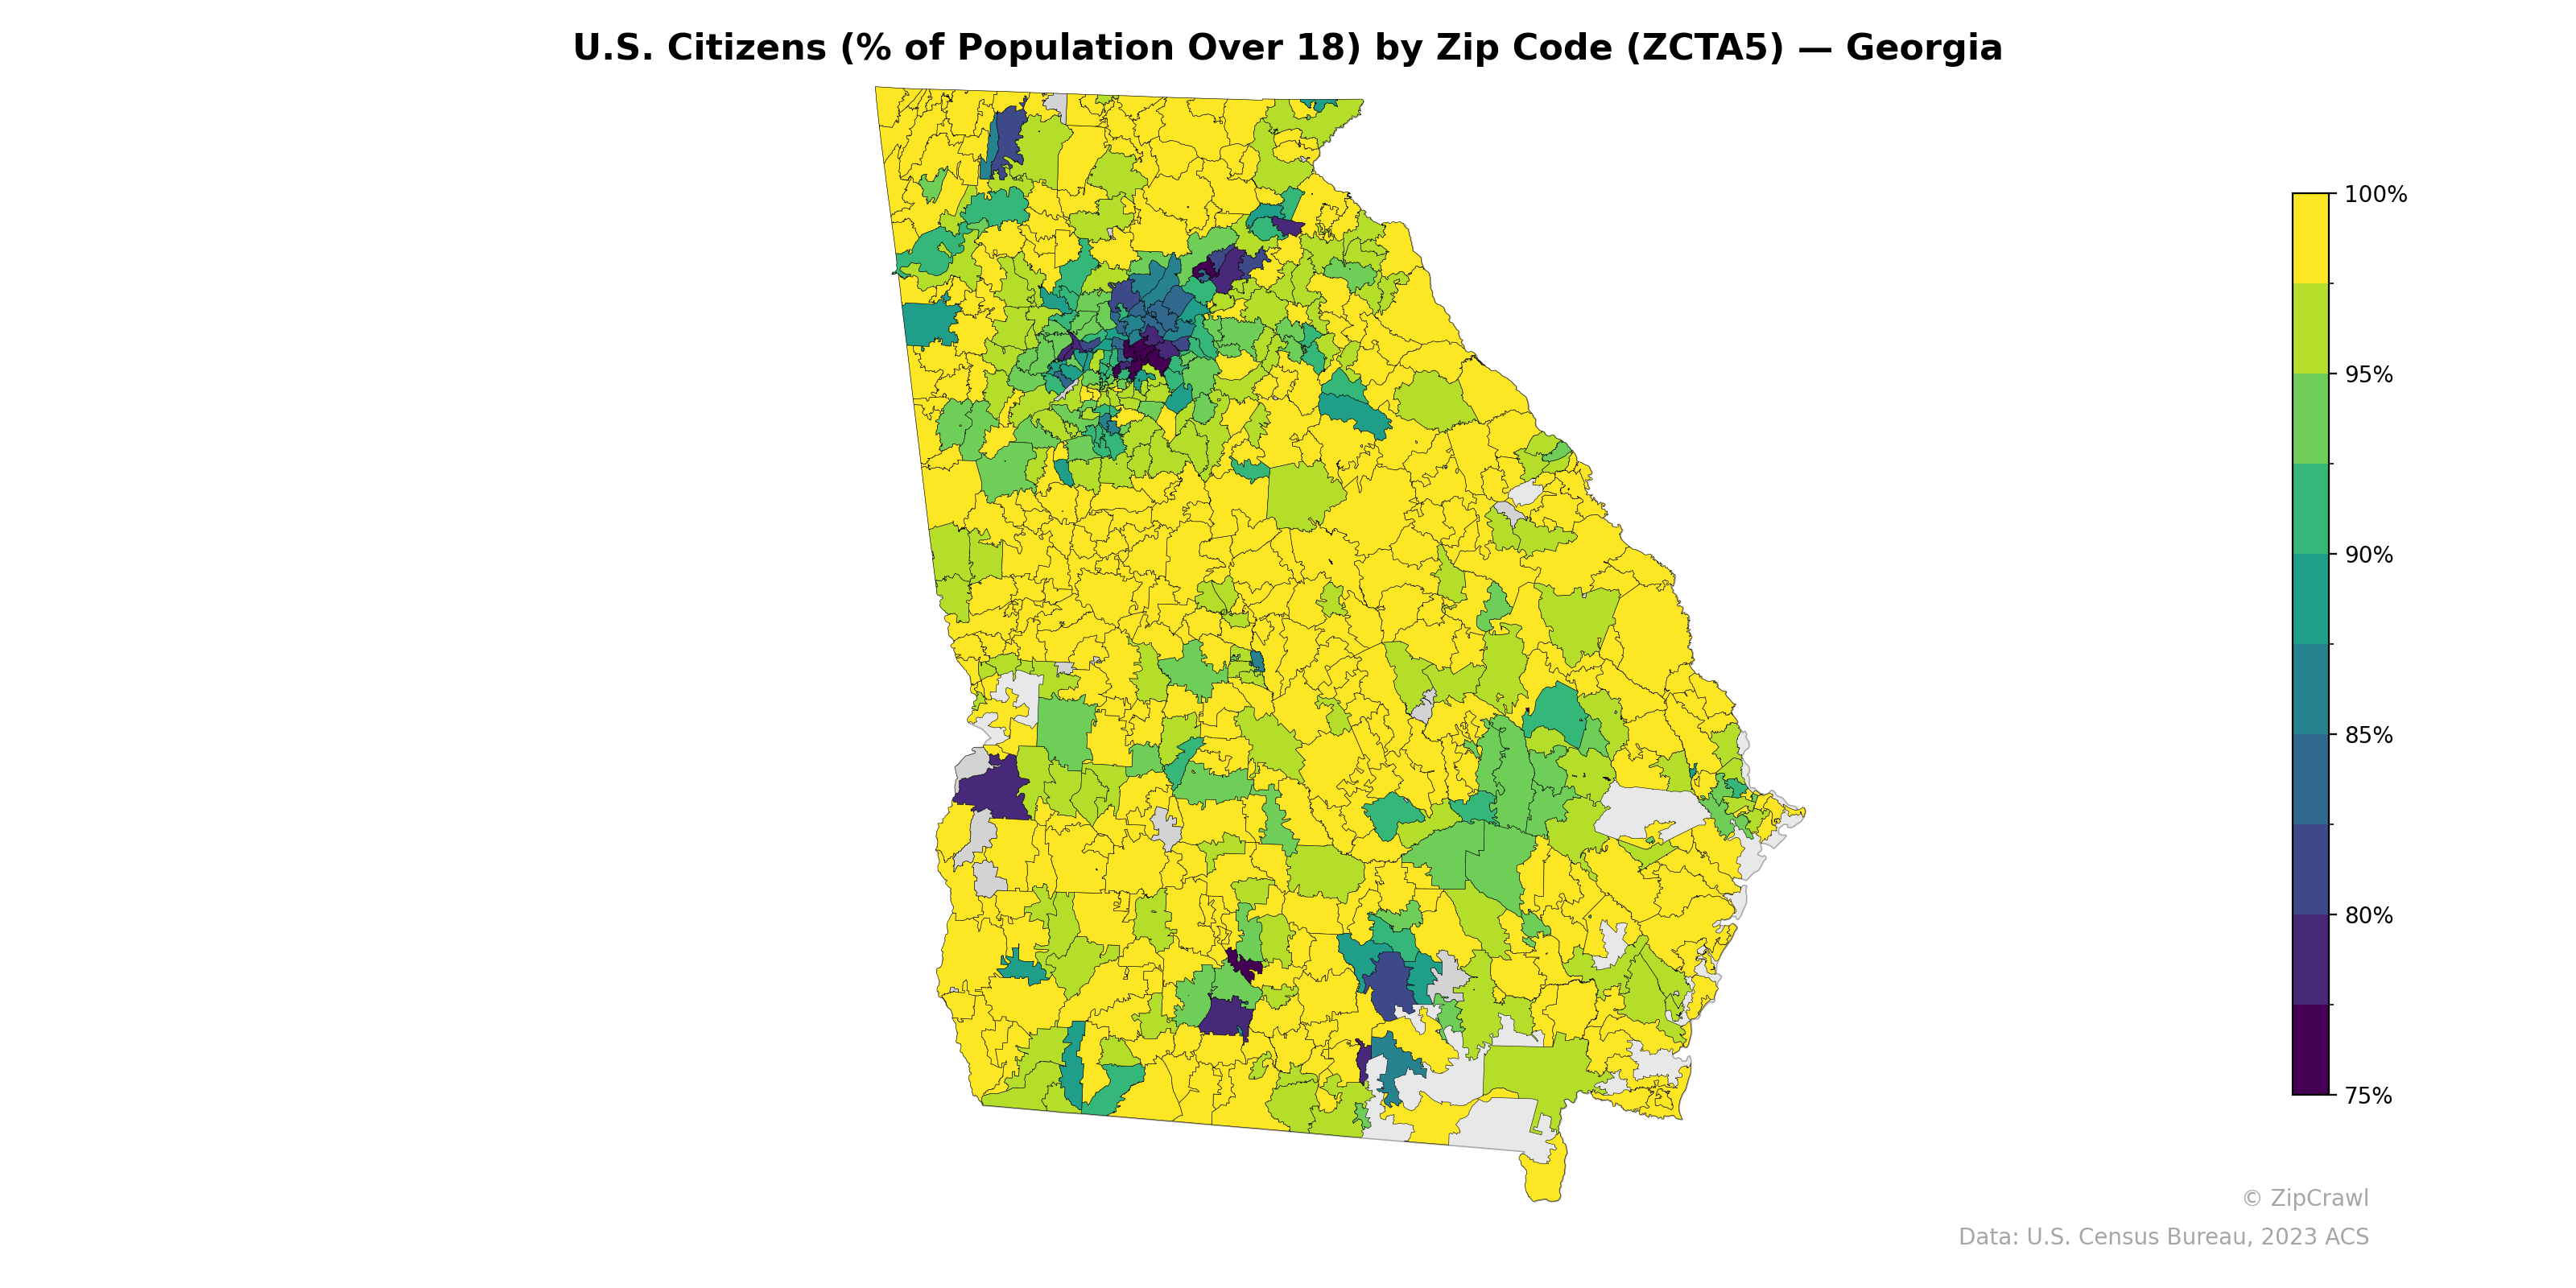
The Atlanta metropolitan area exhibits the lowest U.S. citizenship rates among adults in Georgia, with several zip codes in the core urban and suburban areas falling below 80%, likely reflecting significant immigrant populations concentrated in the metro region. A secondary cluster of lower citizenship percentages appears in southern Georgia around the Valdosta area and parts of the coastal southeast, potentially tied to agricultural labor and military-adjacent communities. Rural areas across central, eastern, and southern Georgia overwhelmingly report near-100% citizenship rates, creating a stark contrast with the metro Atlanta corridor and highlighting the geographic concentration of non-citizen populations in a relatively small number of zip codes.
Data: U.S. Census Bureau, 2023 ACS
Explore
- Household Median Income by Zip Code (ZCTA5) — New York Metro
- Population Non-Hispanic American Indian % by Zip Code (ZCTA5) — Georgia
- Median Age by Zip Code (ZCTA5) — Georgia
- Population Non-Hispanic White % by Zip Code (ZCTA5) — Georgia
- Population Non-Hispanic Black % by Zip Code (ZCTA5) — Georgia
- % of Population on Food Stamps or SNAP (Last 12 Months), by Zip Code (ZCTA5) — Ohio
- Population Hispanic % by Zip Code (ZCTA5) — Georgia
- High School Graduate (% of Over 25) by Zip Code (ZCTA5) — Georgia
- Population Non-Hispanic Asian % by Zip Code (ZCTA5) — Ohio
- Household Median Income by Zip Code (ZCTA5) — Georgia
- Bachelor's Degree or Higher (% of Over 25) by Zip Code (ZCTA5) — Utah
- Median Age by County
- Bachelor's Degree or Higher (% of Over 25) by Zip Code (ZCTA5) — New York Metro
- Population Non-Hispanic White % by Zip Code (ZCTA5) — New York Metro
- Population Hispanic % by Zip Code (ZCTA5) — New York Metro
- % of Population on Food Stamps or SNAP (Last 12 Months), by County
- Population Non-Hispanic Black % by Zip Code (ZCTA5) — New York Metro
- Population Non-Hispanic American Indian % by Zip Code (ZCTA5) — New York Metro
- Median Age by Zip Code (ZCTA5) — New York Metro
- High School Graduate (% of Over 25) by Zip Code (ZCTA5) — New York Metro
- Housing Median Monthly Rent ($), by Zip Code (ZCTA5) — Ohio
- Housing Owner-Occupied % of Units, by Zip Code (ZCTA5) — Ohio
- Housing % of Units Built Since 2010, by Zip Code (ZCTA5) — Ohio
- High School Graduate (% of Over 25) by Zip Code (ZCTA5) — Ohio
- Population Non-Hispanic American Indian % by Zip Code (ZCTA5) — Ohio
- Bachelor's Degree or Higher (% of Over 25) by Zip Code (ZCTA5) — Ohio
- % of Population without Health Insurance, by Zip Code (ZCTA5) — Ohio
- Population Hispanic % by Zip Code (ZCTA5) — Ohio
- Housing Owner-Occupied Median Value ($), by Zip Code (ZCTA5) — Ohio
- Population Non-Hispanic White % by Zip Code (ZCTA5) — Ohio
- U.S. Citizens (% of Population Over 18) by Zip Code (ZCTA5) — Utah
- U.S. Citizens (% of Population Over 18) by Zip Code (ZCTA5) — Ohio
- U.S. Citizens (% of Population Over 18) by Zip Code (ZCTA5) — Virginia
- U.S. Citizens (% of Population Over 18) by Zip Code (ZCTA5) — Iowa
- U.S. Citizens (% of Population Over 18) by Zip Code (ZCTA5) — Oregon
- U.S. Citizens (% of Population Over 18) by Zip Code (ZCTA5) — Maine
- U.S. Citizens (% of Population Over 18) by Zip Code (ZCTA5) — Texas
- U.S. Citizens (% of Population Over 18) by Zip Code (ZCTA5) — Idaho
- U.S. Citizens (% of Population Over 18) by Zip Code (ZCTA5) — Nevada
- U.S. Citizens (% of Population Over 18) by Zip Code (ZCTA5) — Kansas