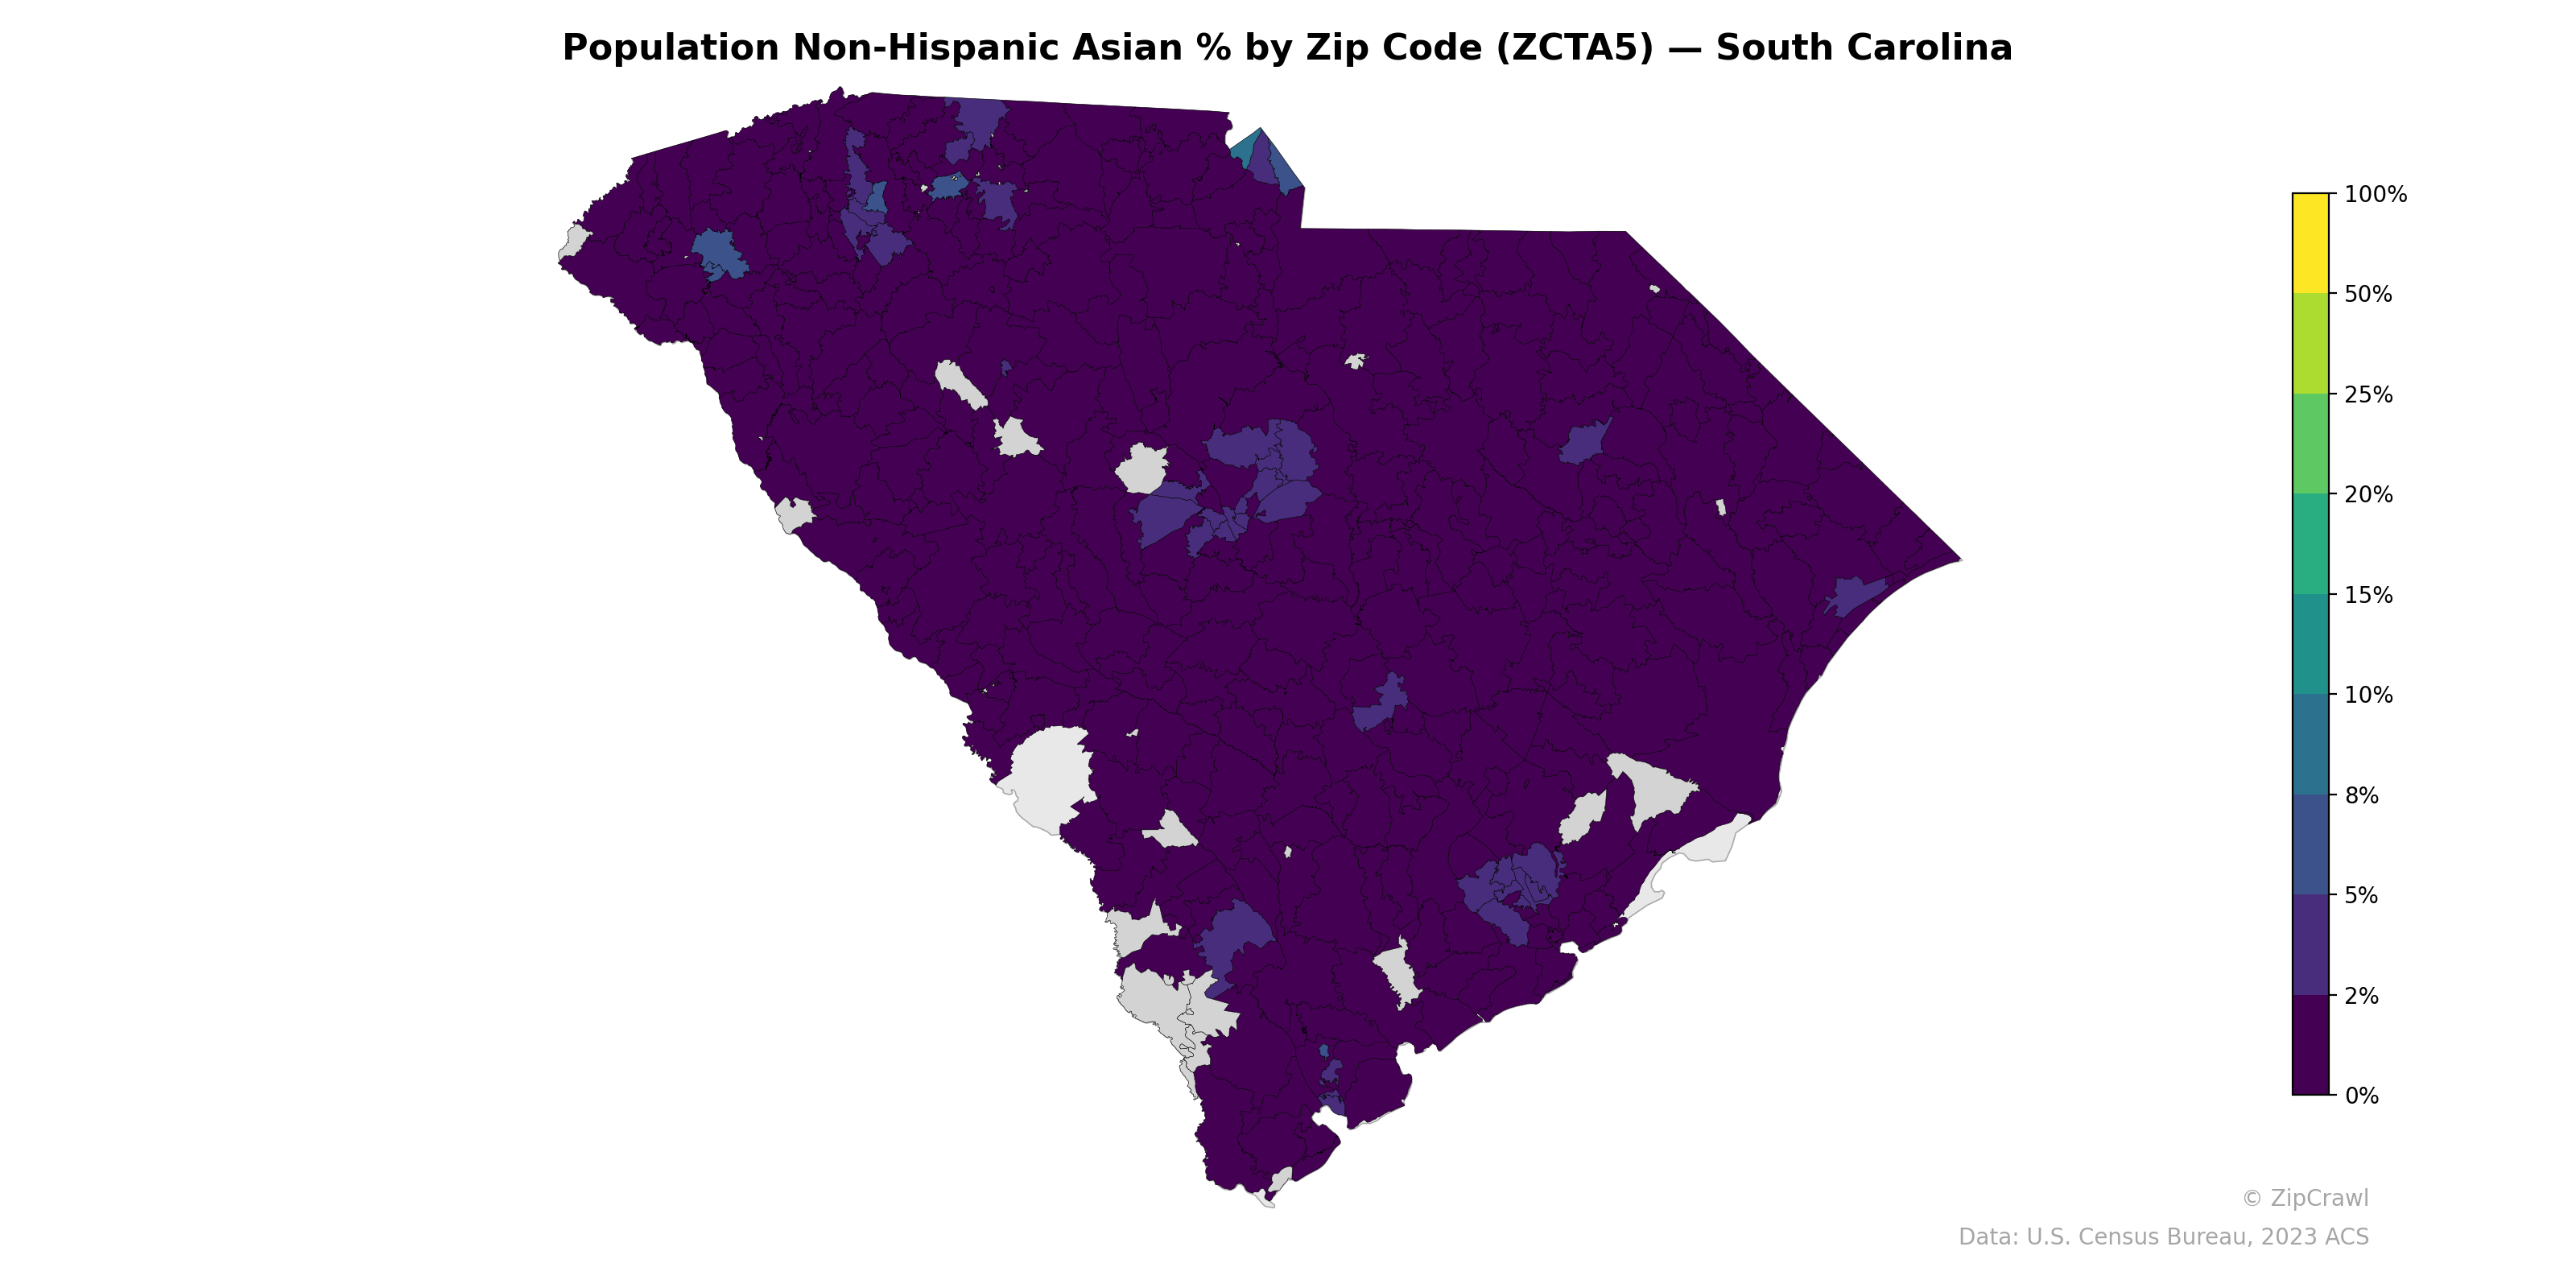
NOTE: Gray indicates insufficient data or a suppressed estimate.
Non-Hispanic Asian population concentrations in South Carolina are highest in zip codes associated with major metropolitan and university areas, particularly in the Greenville-Spartanburg corridor in the northwest, the Columbia metropolitan area in the central part of the state, and the Charleston region along the southeastern coast, where several zip codes reach the 5–10% range. The vast majority of the state's rural zip codes, especially across the Pee Dee region in the northeast and the rural Lowcountry, register near 0–2% Asian population. The pattern strongly reflects the distribution of higher education institutions, healthcare systems, and technology-sector employment hubs that typically attract Asian immigrant and professional communities.
Data: U.S. Census Bureau, 2023 ACS
Explore
- Housing Median Monthly Rent ($), by Zip Code (ZCTA5) — Texas
- Housing Vacancy Rate by Zip Code (ZCTA5) — South Carolina
- Population Hispanic % by Zip Code (ZCTA5) — Wisconsin
- U.S. Citizens (% of Population Over 18) by Zip Code (ZCTA5) — Wisconsin
- Population Non-Hispanic Black % by Zip Code (ZCTA5) — Wisconsin
- Population Non-Hispanic White % by Zip Code (ZCTA5) — Wisconsin
- Median Age by Zip Code (ZCTA5) — Wisconsin
- Married Couple (% of all Households) by Zip Code (ZCTA5) — South Carolina
- Household Median Income by Zip Code (ZCTA5) — Wisconsin
- % of Population on Food Stamps or SNAP (Last 12 Months), by Zip Code (ZCTA5) — South Carolina
- Bachelor's Degree or Higher (% of Over 25) by County
- Married Couple (% of all Households) by Zip Code (ZCTA5) — Texas
- Housing Vacancy Rate by Zip Code (ZCTA5) — Texas
- Housing Owner-Occupied % of Units, by Zip Code (ZCTA5) — Texas
- Housing % of Units Built Since 2010, by Zip Code (ZCTA5) — Texas
- Housing Owner-Occupied Median Value ($), by Zip Code (ZCTA5) — Texas
- Bachelor's Degree or Higher (% of Over 25) by Zip Code (ZCTA5) — Texas
- % of Households with Broadband Internet, by Zip Code (ZCTA5) — Texas
- % of Population without Health Insurance, by Zip Code (ZCTA5) — Texas
- % of Population without Health Insurance, by Zip Code (ZCTA5) — Los Angeles Metro
- Household Average Size by Zip Code (ZCTA5) — Texas
- High School Graduate (% of Over 25) by Zip Code (ZCTA5) — Wisconsin
- % of Population on Food Stamps or SNAP (Last 12 Months), by Zip Code (ZCTA5) — Wisconsin
- Population Non-Hispanic American Indian % by Zip Code (ZCTA5) — Wisconsin
- U.S. Citizens (% of Population Over 18) by Zip Code (ZCTA5) — Colorado
- Household Average Size by Zip Code (ZCTA5) — Wisconsin
- Married Couple (% of all Households) by Zip Code (ZCTA5) — Wisconsin
- Bachelor's Degree or Higher (% of Over 25) by Zip Code (ZCTA5) — Wisconsin
- Housing % of Units Built Since 2010, by Zip Code (ZCTA5) — Wisconsin
- Housing Vacancy Rate by Zip Code (ZCTA5) — Wisconsin
- Population Non-Hispanic Asian % by Zip Code (ZCTA5) — North Carolina
- Population Non-Hispanic Asian % by Zip Code (ZCTA5) — South Dakota
- Population Non-Hispanic Asian % by Zip Code (ZCTA5) — Indiana
- Population Non-Hispanic Asian % by Zip Code (ZCTA5) — Arizona
- Population Non-Hispanic Asian % by Zip Code (ZCTA5) — Iowa
- Population Non-Hispanic Asian % by Zip Code (ZCTA5) — Ohio
- Population Non-Hispanic Asian % by Zip Code (ZCTA5) — Utah
- Population Non-Hispanic Asian % by Zip Code (ZCTA5) — Montana
- Population Non-Hispanic Asian % by Zip Code (ZCTA5) — Louisiana
- Population Non-Hispanic Asian % by Zip Code (ZCTA5) — Oregon