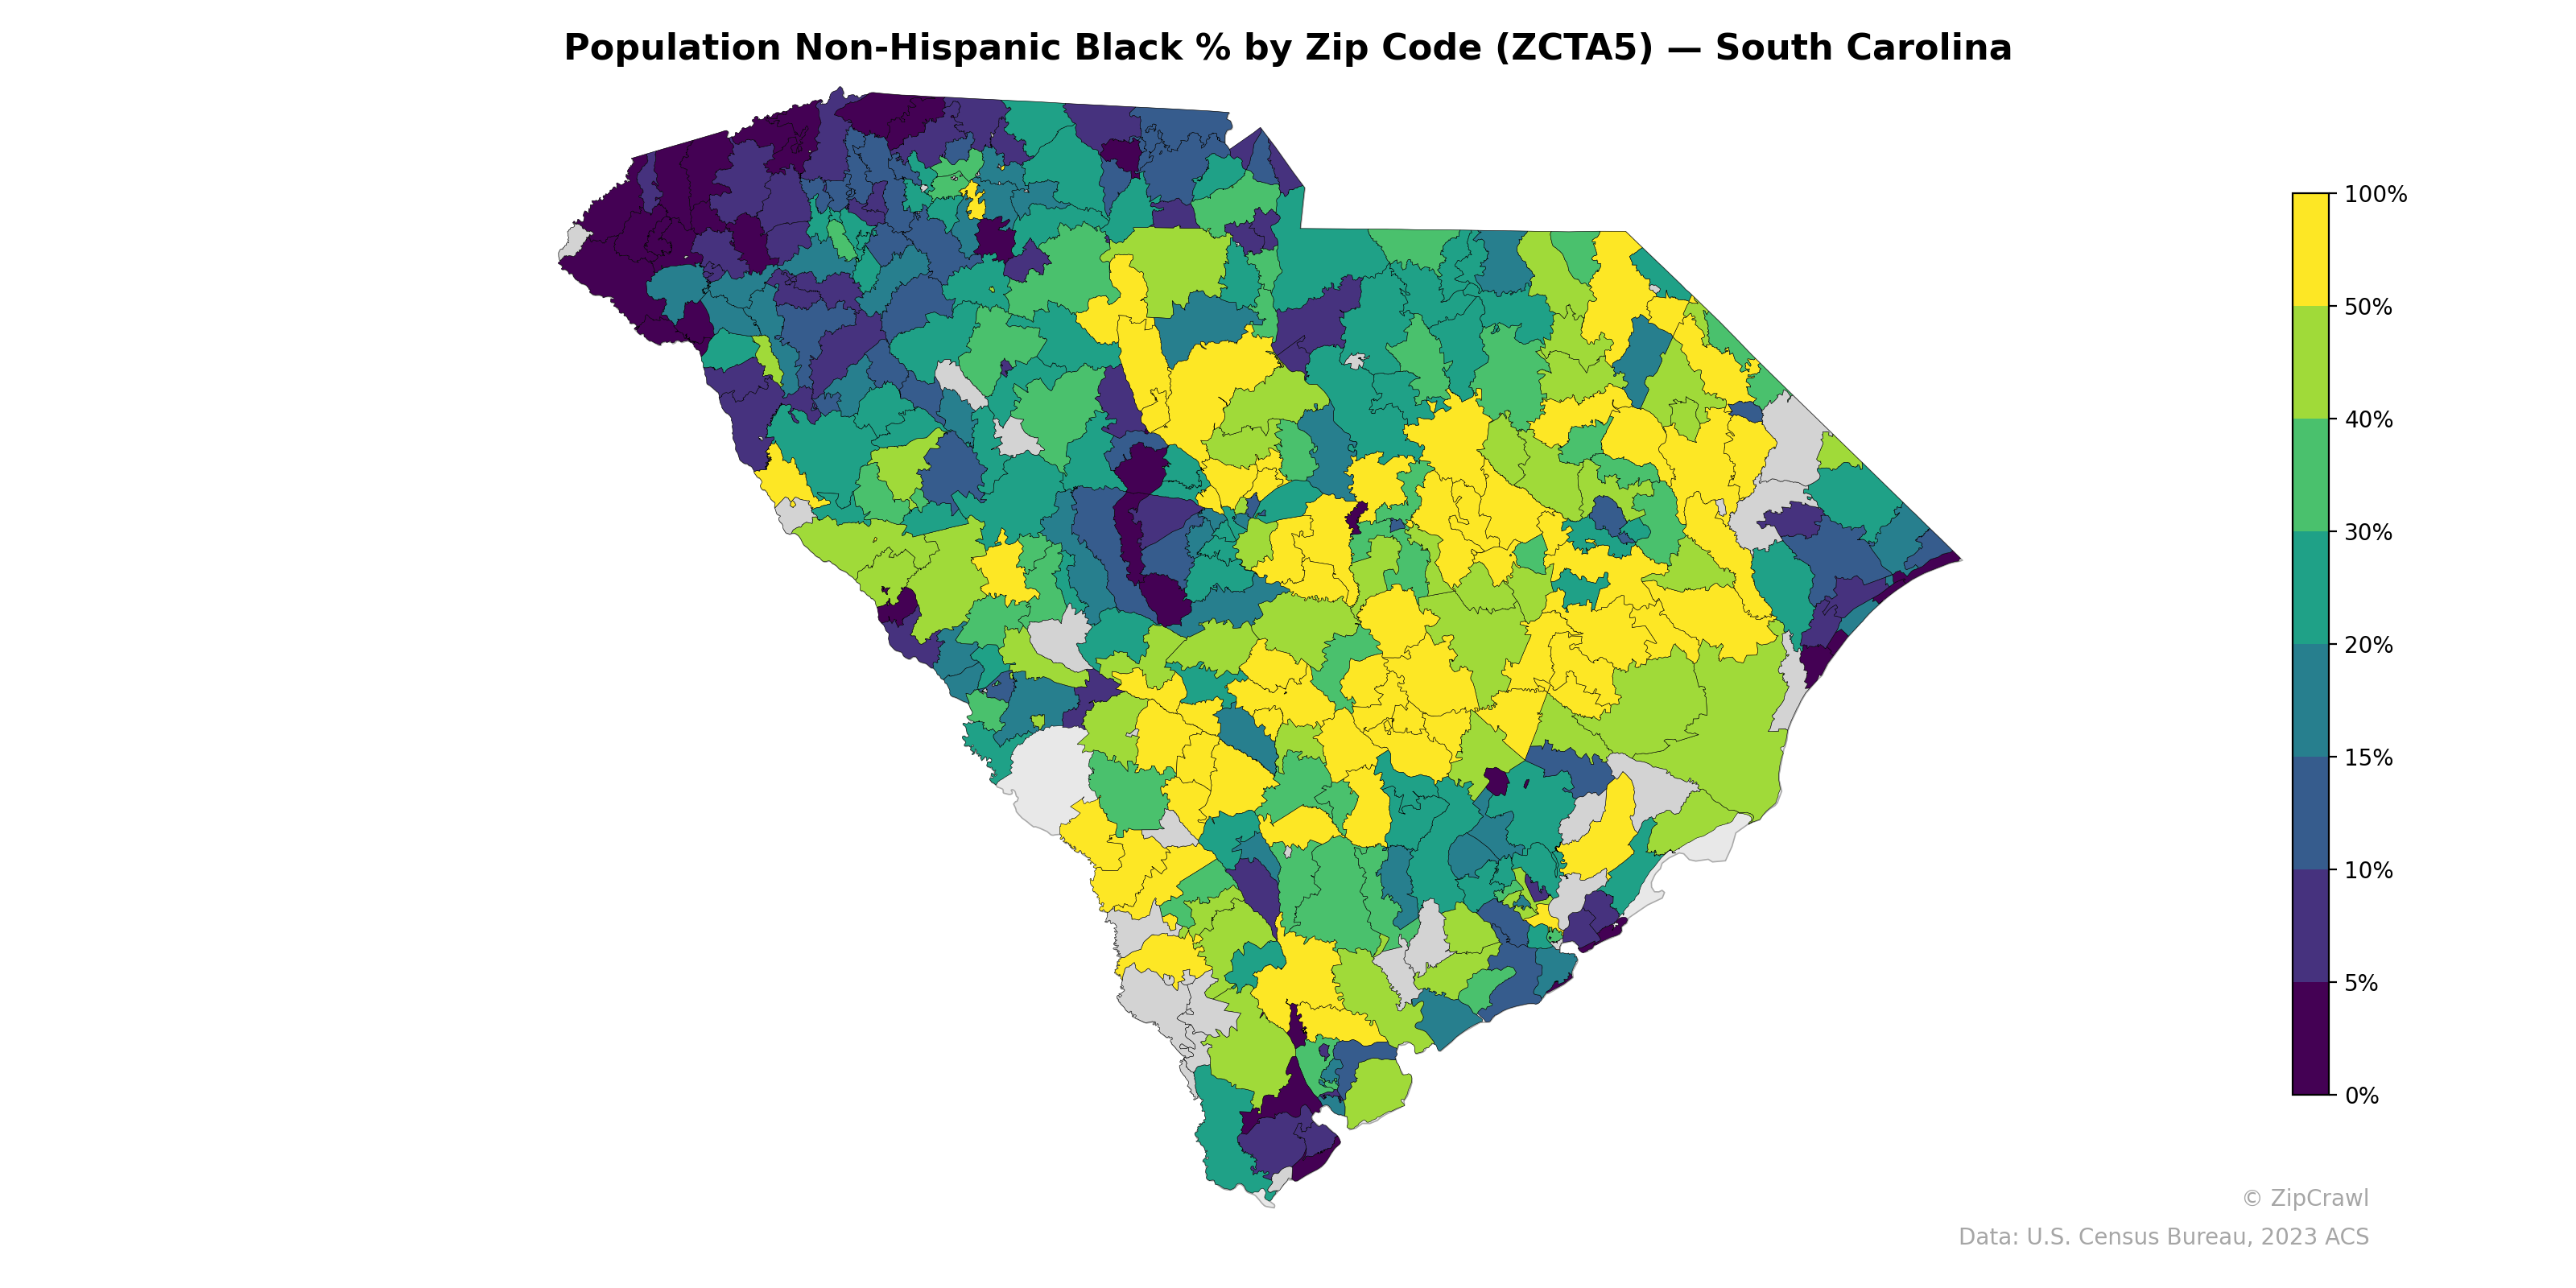
NOTE: Gray indicates insufficient data or a suppressed estimate.
The central corridor of South Carolina stretching from the Midlands through the Pee Dee region exhibits consistently high Non-Hispanic Black population percentages, with numerous zip codes exceeding 50%, reflecting the historically significant Black Belt demographic pattern. The northwestern Upstate region, particularly around Greenville and Spartanburg, displays markedly lower concentrations, with many zip codes falling below 10%, creating a stark contrast with the rest of the state. Coastal zip codes present a mixed pattern, with pockets of high concentration near Charleston and Beaufort interspersed with lower-percentage areas along the Grand Strand and barrier islands.
Data: U.S. Census Bureau, 2023 ACS
Explore
- Housing Owner-Occupied % of Units, by Zip Code (ZCTA5) — Texas
- % of Population on Food Stamps or SNAP (Last 12 Months), by Zip Code (ZCTA5) — Minnesota
- Married Couple (% of all Households) by Zip Code (ZCTA5) — Minnesota
- Housing Vacancy Rate by Zip Code (ZCTA5) — Minnesota
- Median Age by Zip Code (ZCTA5) — South Carolina
- Population Non-Hispanic White % by Zip Code (ZCTA5) — South Carolina
- U.S. Citizens (% of Population Over 18) by Zip Code (ZCTA5) — South Carolina
- Population Non-Hispanic Asian % by Zip Code (ZCTA5) — Minnesota
- Household Median Income by Zip Code (ZCTA5) — South Carolina
- Population Hispanic % by Zip Code (ZCTA5) — South Carolina
- Bachelor's Degree or Higher (% of Over 25) by County
- % of Population without Health Insurance, by Zip Code (ZCTA5) — Texas
- Bachelor's Degree or Higher (% of Over 25) by Zip Code (ZCTA5) — Texas
- Married Couple (% of all Households) by Zip Code (ZCTA5) — Texas
- Household Average Size by Zip Code (ZCTA5) — Texas
- Housing % of Units Built Since 2010, by Zip Code (ZCTA5) — Texas
- Housing Median Monthly Rent ($), by Zip Code (ZCTA5) — Texas
- Housing Owner-Occupied Median Value ($), by Zip Code (ZCTA5) — Texas
- % of Households with Broadband Internet, by Zip Code (ZCTA5) — Texas
- Population Non-Hispanic Asian % by Zip Code (ZCTA5) — New York Metro
- Housing Vacancy Rate by Zip Code (ZCTA5) — Texas
- Bachelor's Degree or Higher (% of Over 25) by Zip Code (ZCTA5) — Wisconsin
- % of Population on Food Stamps or SNAP (Last 12 Months), by Zip Code (ZCTA5) — Wisconsin
- High School Graduate (% of Over 25) by Zip Code (ZCTA5) — Wisconsin
- Population Non-Hispanic American Indian % by Zip Code (ZCTA5) — Wisconsin
- Population Non-Hispanic White % by Zip Code (ZCTA5) — Wisconsin
- U.S. Citizens (% of Population Over 18) by Zip Code (ZCTA5) — Colorado
- Household Average Size by Zip Code (ZCTA5) — Wisconsin
- Median Age by Zip Code (ZCTA5) — Wisconsin
- Married Couple (% of all Households) by Zip Code (ZCTA5) — Wisconsin
- Population Non-Hispanic Black % by Zip Code (ZCTA5) — North Carolina
- Population Non-Hispanic Black % by Zip Code (ZCTA5) — South Dakota
- Population Non-Hispanic Black % by Zip Code (ZCTA5) — Ohio
- Population Non-Hispanic Black % by Zip Code (ZCTA5) — Iowa
- Population Non-Hispanic Black % by Zip Code (ZCTA5) — Utah
- Population Non-Hispanic Black % by Zip Code (ZCTA5) — Arizona
- Population Non-Hispanic Black % by Zip Code (ZCTA5) — Indiana
- Population Non-Hispanic Black % by Zip Code (ZCTA5) — Montana
- Population Non-Hispanic Black % by Zip Code (ZCTA5) — Nevada
- Population Non-Hispanic Black % by Zip Code (ZCTA5) — Oregon