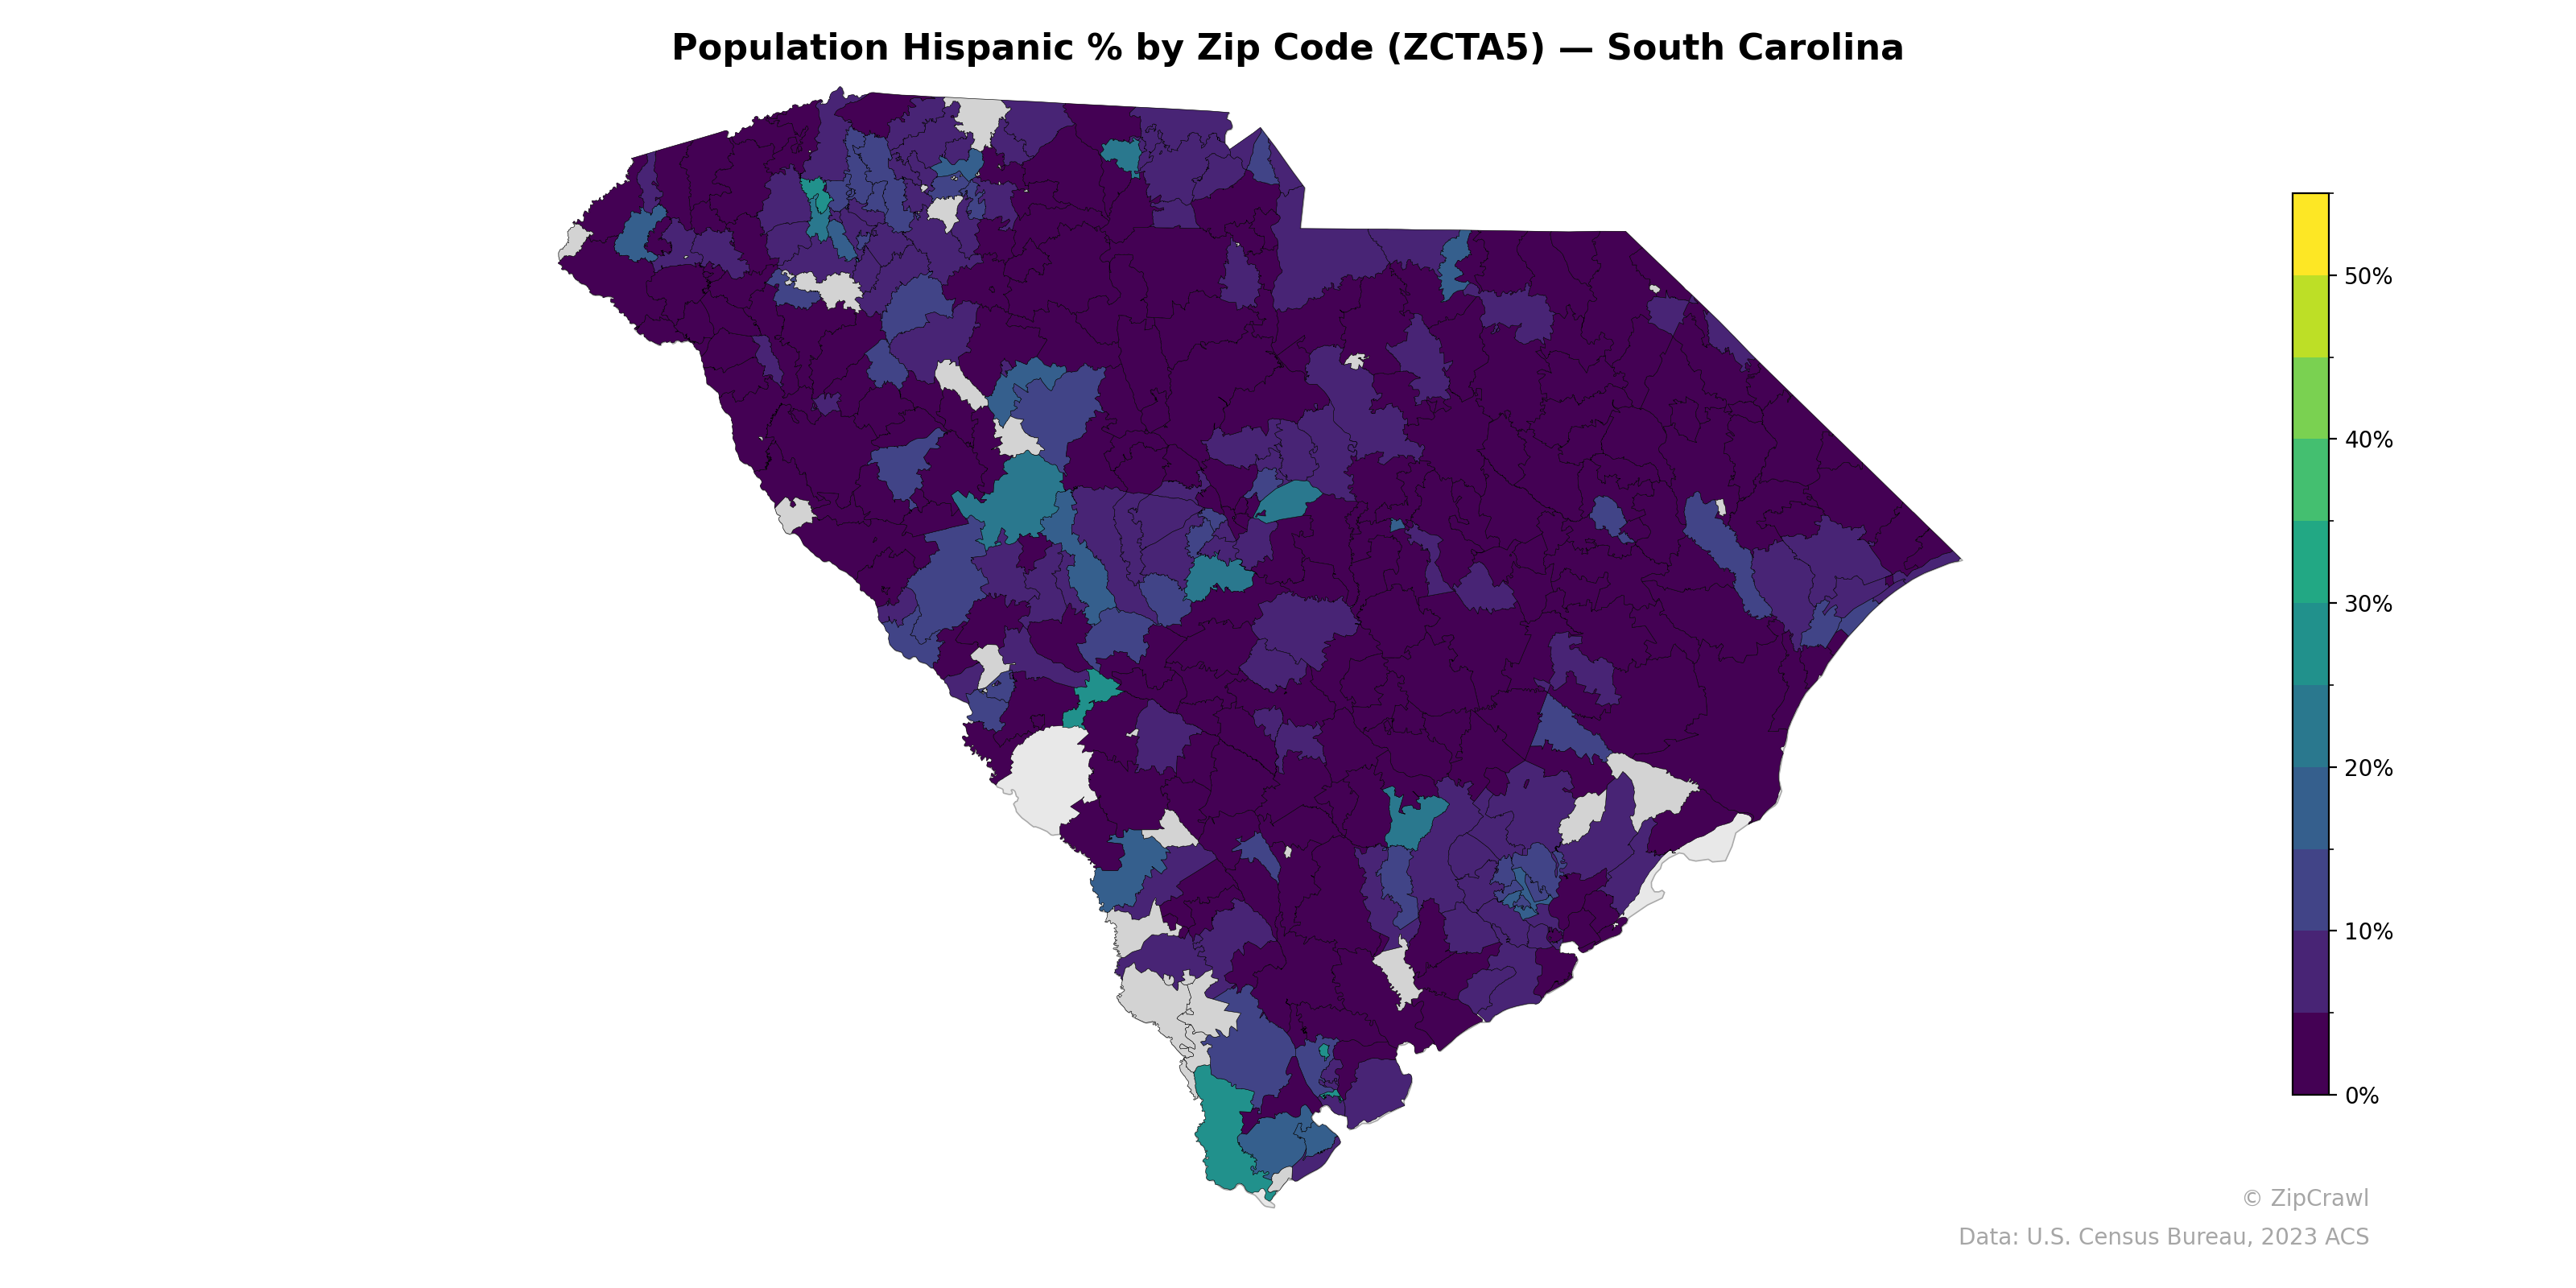
NOTE: Gray indicates insufficient data or a suppressed estimate.
Hispanic population concentrations in South Carolina are most prominent in the northwestern Upstate region—particularly around Greenville and Spartanburg—where several zip codes exceed 20-30%, reflecting the area's established Latino workforce in manufacturing and agriculture. A secondary cluster appears along the southern coastal zone near Beaufort and Hilton Head Island, where zip codes reach similar elevated percentages, likely driven by service and hospitality industry employment. The vast majority of the state's interior and Pee Dee region remains below 10% Hispanic, creating a stark contrast between these isolated pockets of concentration and the predominantly low-Hispanic rural landscape.
Data: U.S. Census Bureau, 2023 ACS
Explore
- Housing Owner-Occupied % of Units, by Zip Code (ZCTA5) — Texas
- % of Population on Food Stamps or SNAP (Last 12 Months), by Zip Code (ZCTA5) — Minnesota
- U.S. Citizens (% of Population Over 18) by Zip Code (ZCTA5) — South Carolina
- Housing Vacancy Rate by Zip Code (ZCTA5) — Minnesota
- Population Non-Hispanic White % by Zip Code (ZCTA5) — South Carolina
- Median Age by Zip Code (ZCTA5) — South Carolina
- Married Couple (% of all Households) by Zip Code (ZCTA5) — Minnesota
- Population Non-Hispanic Asian % by Zip Code (ZCTA5) — Minnesota
- Household Median Income by Zip Code (ZCTA5) — South Carolina
- Population Non-Hispanic Black % by Zip Code (ZCTA5) — South Carolina
- Bachelor's Degree or Higher (% of Over 25) by County
- Married Couple (% of all Households) by Zip Code (ZCTA5) — Texas
- % of Population without Health Insurance, by Zip Code (ZCTA5) — Texas
- Housing Owner-Occupied Median Value ($), by Zip Code (ZCTA5) — Texas
- Housing Vacancy Rate by Zip Code (ZCTA5) — Texas
- Housing % of Units Built Since 2010, by Zip Code (ZCTA5) — Texas
- Housing Median Monthly Rent ($), by Zip Code (ZCTA5) — Texas
- Bachelor's Degree or Higher (% of Over 25) by Zip Code (ZCTA5) — Texas
- % of Households with Broadband Internet, by Zip Code (ZCTA5) — Texas
- Housing Vacancy Rate by Zip Code (ZCTA5) — New York Metro
- Household Average Size by Zip Code (ZCTA5) — Texas
- Bachelor's Degree or Higher (% of Over 25) by Zip Code (ZCTA5) — Wisconsin
- Population Non-Hispanic American Indian % by Zip Code (ZCTA5) — Wisconsin
- Population Non-Hispanic Black % by Zip Code (ZCTA5) — Wisconsin
- Population Non-Hispanic White % by Zip Code (ZCTA5) — Wisconsin
- High School Graduate (% of Over 25) by Zip Code (ZCTA5) — Wisconsin
- % of Population on Food Stamps or SNAP (Last 12 Months), by Zip Code (ZCTA5) — Wisconsin
- Married Couple (% of all Households) by Zip Code (ZCTA5) — Wisconsin
- Household Average Size by Zip Code (ZCTA5) — Wisconsin
- Housing Vacancy Rate by Zip Code (ZCTA5) — Wisconsin
- Population Hispanic % by Zip Code (ZCTA5) — North Carolina
- Population Hispanic % by Zip Code (ZCTA5) — South Dakota
- Population Hispanic % by Zip Code (ZCTA5) — Iowa
- Population Hispanic % by Zip Code (ZCTA5) — Utah
- Population Hispanic % by Zip Code (ZCTA5) — Ohio
- Population Hispanic % by Zip Code (ZCTA5) — Arizona
- Population Hispanic % by Zip Code (ZCTA5) — Indiana
- Population Hispanic % by Zip Code (ZCTA5) — Montana
- Population Hispanic % by Zip Code (ZCTA5) — Texas
- Population Hispanic % by Zip Code (ZCTA5) — Hawaii