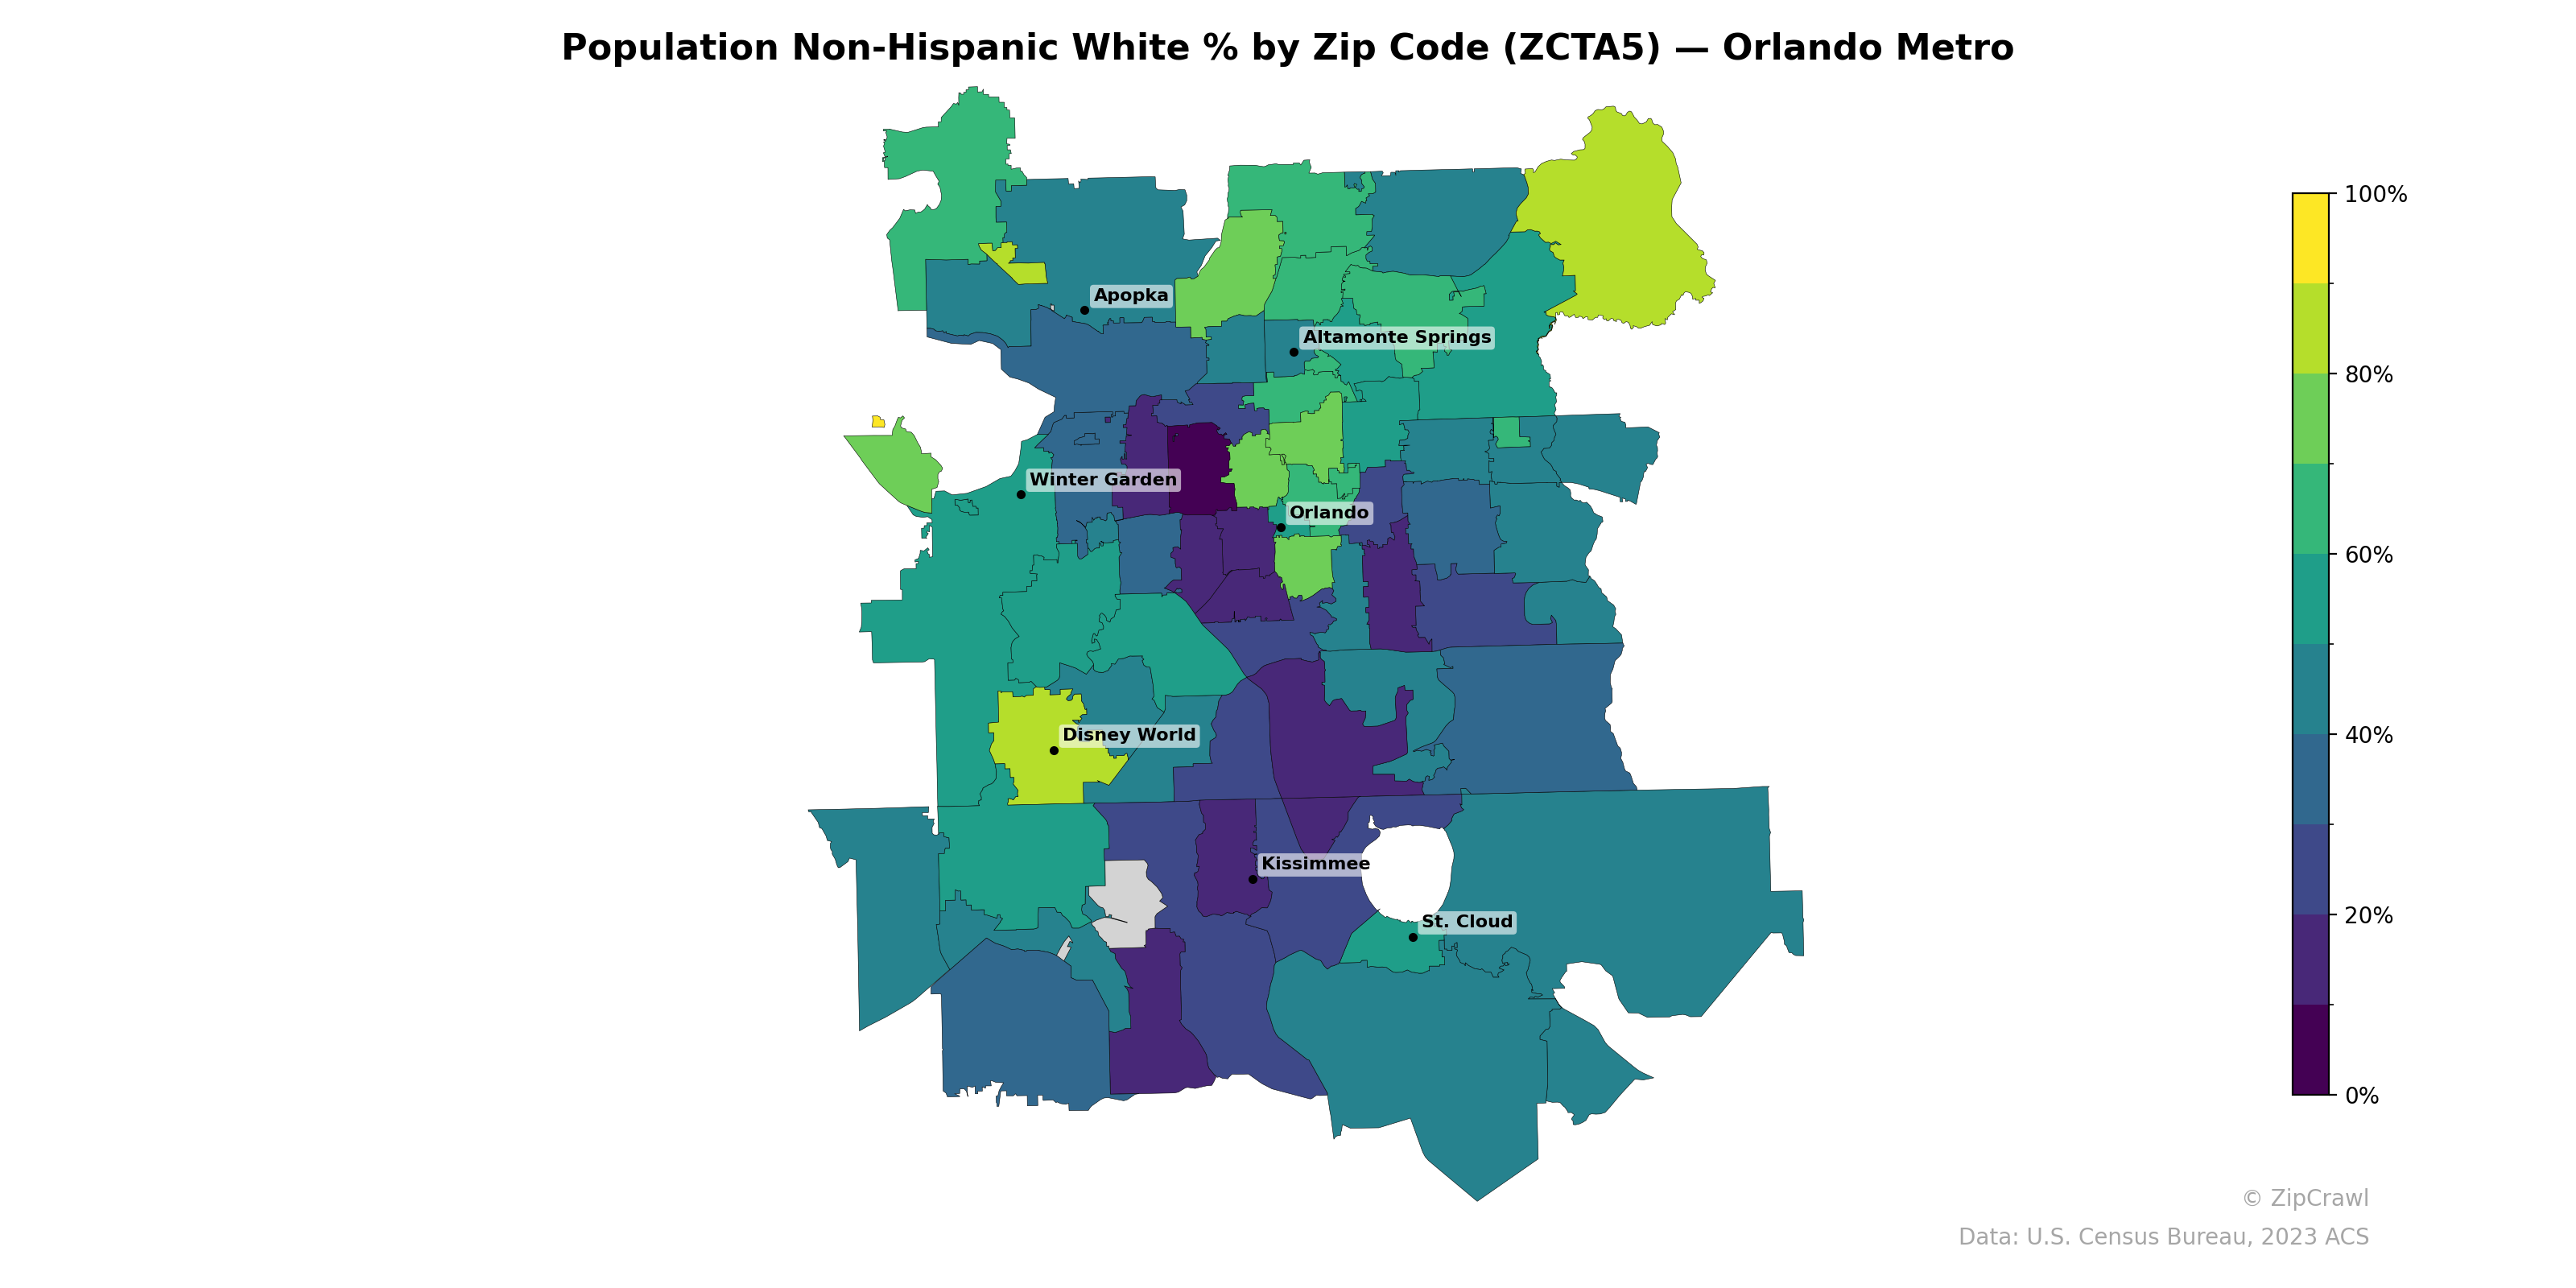
NOTE: Gray indicates insufficient data or a suppressed estimate.
The highest concentrations of non-Hispanic white residents, exceeding 70–80%, cluster in the northern and northwestern portions of the metro, particularly in zip codes north of Apopka and in the far northeast, while the lowest percentages—often below 20%—are found in a corridor running through central Orlando and extending south toward Kissimmee. The area around Disney World and several zip codes in the southwestern quadrant display moderate white population shares in the 40–60% range, creating a transitional zone between the predominantly white northern suburbs and the more diverse central and southern communities. St. Cloud and its surrounding zip codes show notably low non-Hispanic white percentages, contrasting sharply with similarly suburban-density areas to the north and west.
Data: U.S. Census Bureau, 2023 ACS
Explore
- Housing % of Units Built Since 2010, by Zip Code (ZCTA5) — Chicago Metro
- Population Non-Hispanic American Indian % by Zip Code (ZCTA5) — Orlando Metro
- U.S. Citizens (% of Population Over 18) by Zip Code (ZCTA5) — Orlando Metro
- % of Population on Food Stamps or SNAP (Last 12 Months), by Zip Code (ZCTA5) — Denver Metro
- High School Graduate (% of Over 25) by Zip Code (ZCTA5) — Orlando Metro
- Population Hispanic % by Zip Code (ZCTA5) — Orlando Metro
- Median Age by Zip Code (ZCTA5) — Orlando Metro
- Household Median Income by Zip Code (ZCTA5) — Orlando Metro
- Population Non-Hispanic Black % by Zip Code (ZCTA5) — Orlando Metro
- Population Non-Hispanic Asian % by Zip Code (ZCTA5) — Denver Metro
- Population Non-Hispanic American Indian % by County
- Married Couple (% of all Households) by Zip Code (ZCTA5) — Chicago Metro
- Household Average Size by Zip Code (ZCTA5) — Chicago Metro
- Housing Vacancy Rate by Zip Code (ZCTA5) — Chicago Metro
- Housing Owner-Occupied % of Units, by Zip Code (ZCTA5) — Chicago Metro
- Housing Median Monthly Rent ($), by Zip Code (ZCTA5) — Chicago Metro
- Bachelor's Degree or Higher (% of Over 25) by Zip Code (ZCTA5) — Chicago Metro
- % of Households with Broadband Internet, by Zip Code (ZCTA5) — Chicago Metro
- % of Population without Health Insurance, by Zip Code (ZCTA5) — Chicago Metro
- Housing Owner-Occupied Median Value ($), by Zip Code (ZCTA5) — Chicago Metro
- Housing % of Units Built Since 2010, by Zip Code (ZCTA5) — Denver Metro
- Housing Owner-Occupied % of Units, by Zip Code (ZCTA5) — Denver Metro
- Household Average Size by Zip Code (ZCTA5) — Denver Metro
- Population Non-Hispanic American Indian % by Zip Code (ZCTA5) — Denver Metro
- Population Non-Hispanic Black % by Zip Code (ZCTA5) — Denver Metro
- High School Graduate (% of Over 25) by Zip Code (ZCTA5) — Denver Metro
- % of Households with Broadband Internet, by Zip Code (ZCTA5) — Denver Metro
- % of Population without Health Insurance, by Zip Code (ZCTA5) — Denver Metro
- Housing Owner-Occupied Median Value ($), by Zip Code (ZCTA5) — Denver Metro
- Median Age by Zip Code (ZCTA5) — Denver Metro
- Population Non-Hispanic White % by Zip Code (ZCTA5) — Portland Metro
- Population Non-Hispanic White % by Zip Code (ZCTA5) — Miami Metro
- Population Non-Hispanic White % by Zip Code (ZCTA5) — Boston Metro
- Population Non-Hispanic White % by Zip Code (ZCTA5) — Atlanta Metro
- Population Non-Hispanic White % by Zip Code (ZCTA5) — Houston Metro
- Population Non-Hispanic White % by Zip Code (ZCTA5) — Detroit Metro
- Population Non-Hispanic White % by Zip Code (ZCTA5) — Tampa Metro
- Population Non-Hispanic White % by Zip Code (ZCTA5) — Dallas Metro
- Population Non-Hispanic White % by Zip Code (ZCTA5) — Phoenix Metro
- Population Non-Hispanic White % by Zip Code (ZCTA5) — Denver Metro