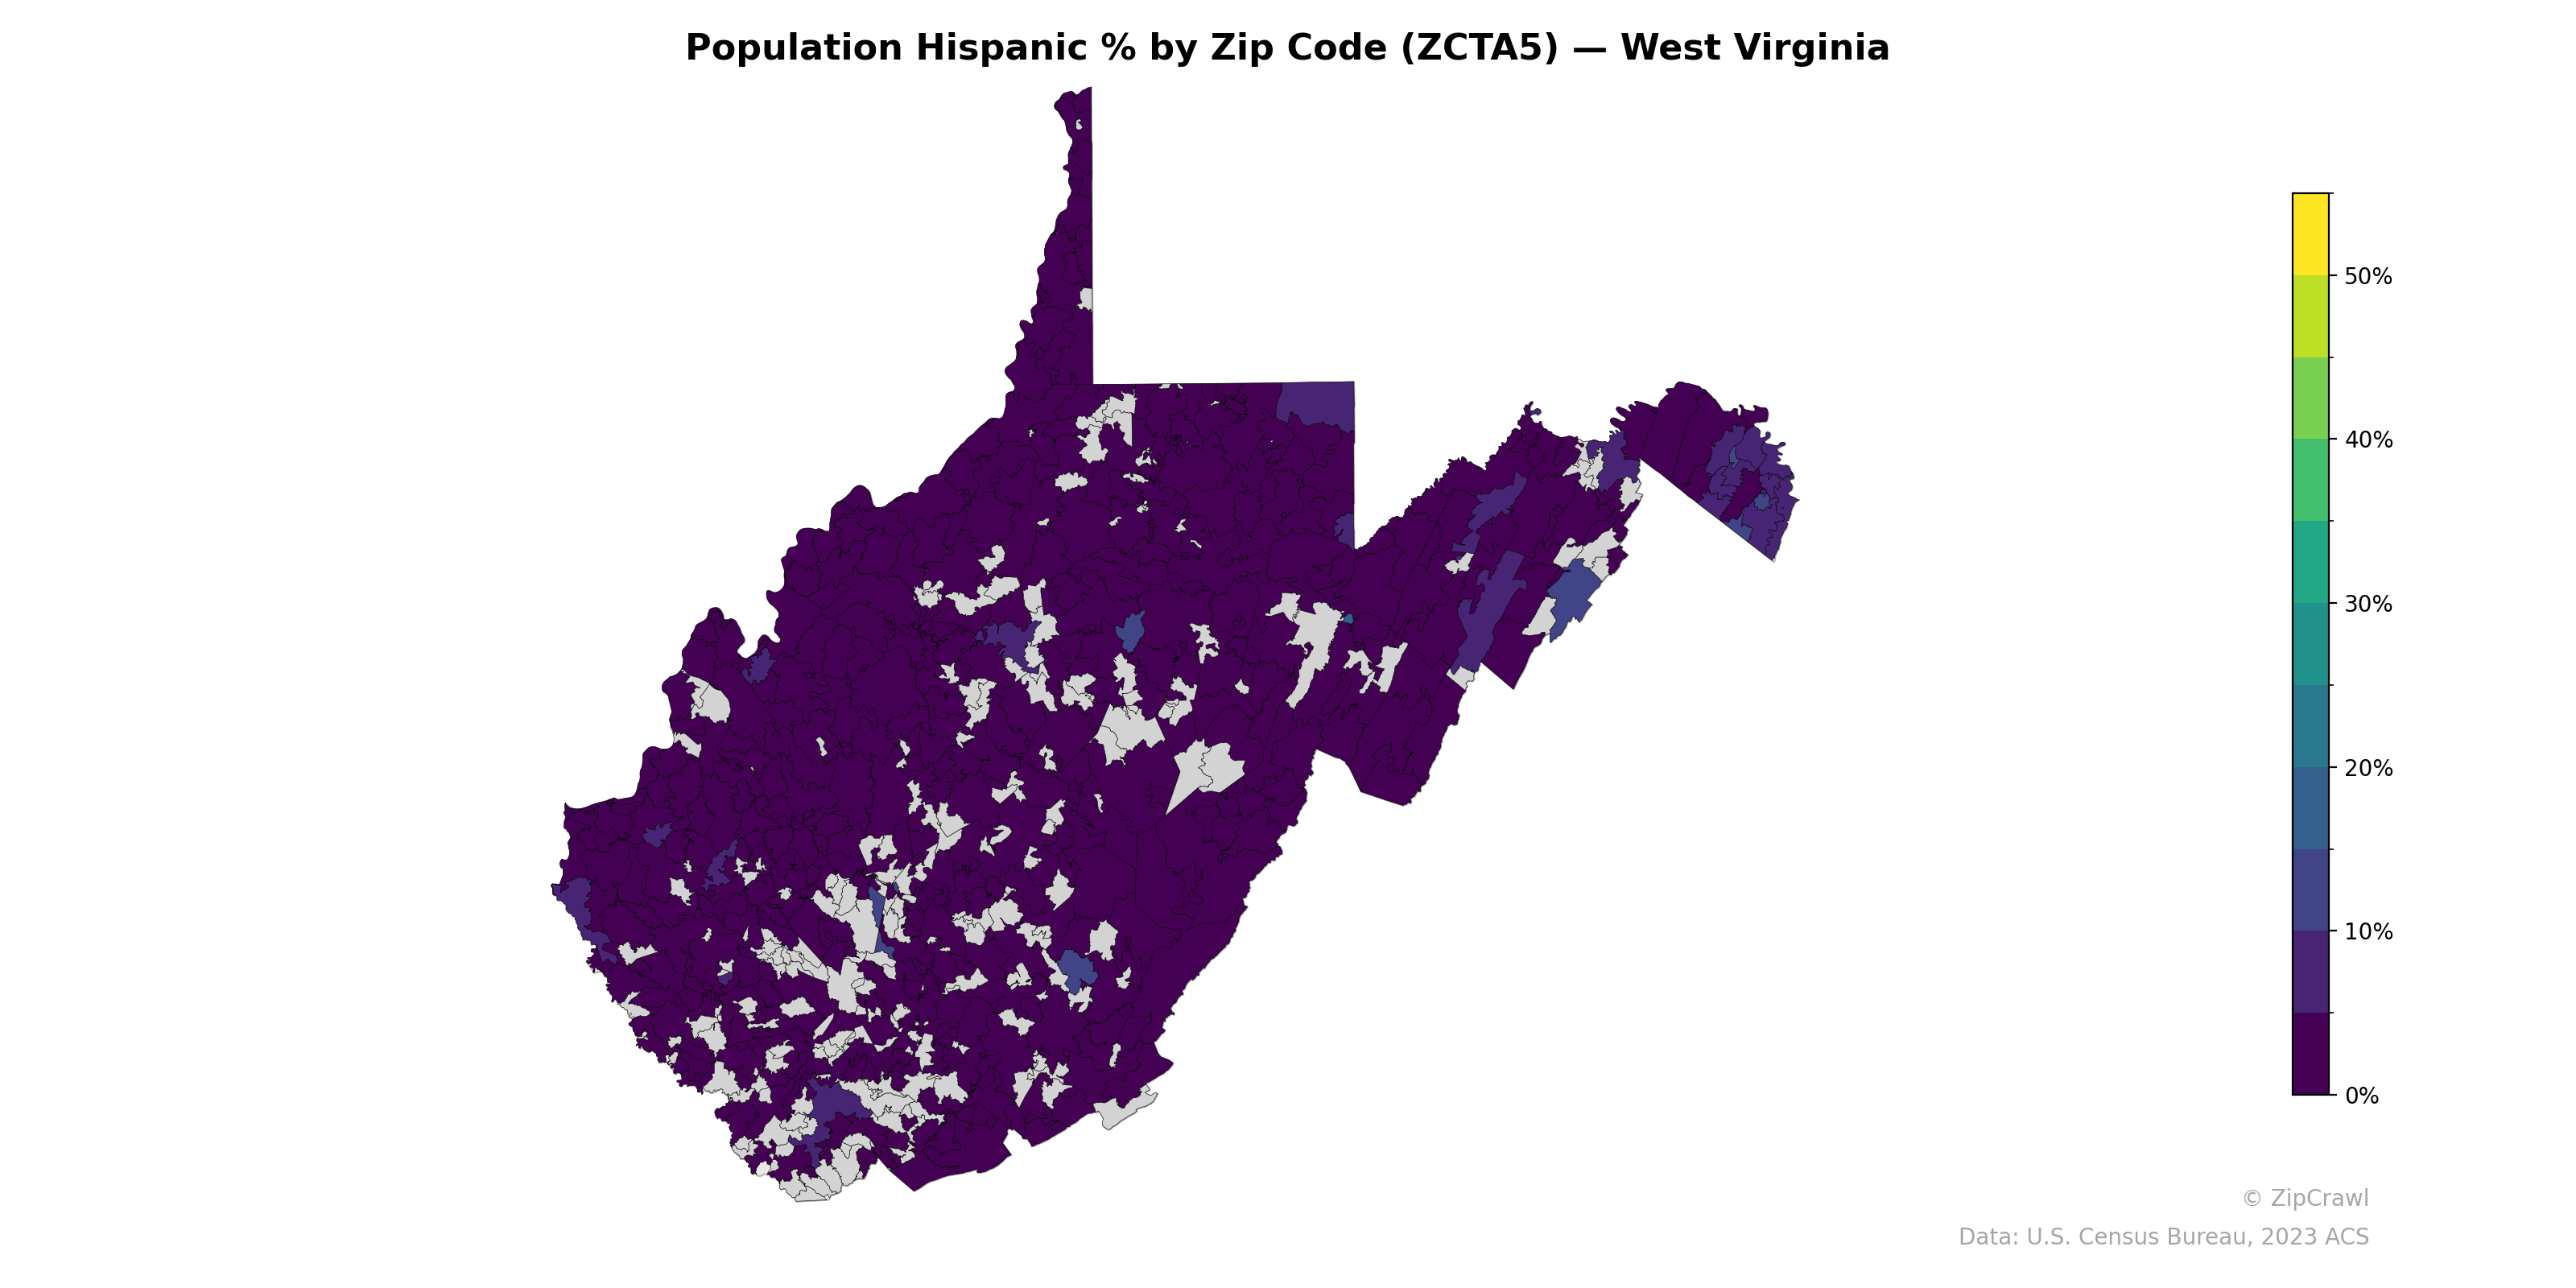
NOTE: Gray indicates insufficient data or a suppressed estimate.
West Virginia's Hispanic population remains exceptionally low across most zip codes, with the vast majority of the state registering near 0%, reflected in the dominant deep purple shading. The Eastern Panhandle region, particularly around the Jefferson and Berkeley County areas near the Virginia border, displays the highest concentrations, with several zip codes reaching into the 5–15% range, likely driven by proximity to the Washington, D.C. metropolitan area. Scattered pockets of slightly elevated Hispanic percentages also appear in north-central areas and along parts of the southern border, though none approach the levels seen in the eastern tip of the state.
Data: U.S. Census Bureau, 2023 ACS
Explore
- Housing Vacancy Rate by Zip Code (ZCTA5) — Florida
- Married Couple (% of all Households) by Zip Code (ZCTA5) — Idaho
- Median Age by Zip Code (ZCTA5) — West Virginia
- Housing Vacancy Rate by Zip Code (ZCTA5) — Idaho
- % of Population on Food Stamps or SNAP (Last 12 Months), by Zip Code (ZCTA5) — Idaho
- Population Non-Hispanic Asian % by Zip Code (ZCTA5) — Idaho
- Population Non-Hispanic Black % by Zip Code (ZCTA5) — West Virginia
- Household Median Income by Zip Code (ZCTA5) — West Virginia
- Population Non-Hispanic White % by Zip Code (ZCTA5) — West Virginia
- U.S. Citizens (% of Population Over 18) by Zip Code (ZCTA5) — West Virginia
- Housing Median Monthly Rent ($), by County
- Household Average Size by Zip Code (ZCTA5) — Florida
- Housing Median Monthly Rent ($), by Zip Code (ZCTA5) — Florida
- Married Couple (% of all Households) by Zip Code (ZCTA5) — Florida
- Housing % of Units Built Since 2010, by Zip Code (ZCTA5) — Florida
- Married Couple (% of all Households) by Zip Code (ZCTA5) — Atlanta Metro
- % of Population without Health Insurance, by Zip Code (ZCTA5) — Florida
- % of Households with Broadband Internet, by Zip Code (ZCTA5) — Florida
- Housing Owner-Occupied % of Units, by Zip Code (ZCTA5) — Florida
- Married Couple (% of all Households) by Zip Code (ZCTA5) — Pennsylvania
- Bachelor's Degree or Higher (% of Over 25) by Zip Code (ZCTA5) — Florida
- Housing Owner-Occupied Median Value ($), by Zip Code (ZCTA5) — Florida
- Housing Vacancy Rate by Zip Code (ZCTA5) — Mississippi
- Bachelor's Degree or Higher (% of Over 25) by Zip Code (ZCTA5) — Mississippi
- Population Non-Hispanic Asian % by Zip Code (ZCTA5) — Mississippi
- % of Households with Broadband Internet, by Zip Code (ZCTA5) — Mississippi
- Population Non-Hispanic American Indian % by Zip Code (ZCTA5) — Mississippi
- % of Population on Food Stamps or SNAP (Last 12 Months), by Zip Code (ZCTA5) — Mississippi
- High School Graduate (% of Over 25) by Zip Code (ZCTA5) — Mississippi
- Housing Median Monthly Rent ($), by Zip Code (ZCTA5) — Mississippi
- Population Hispanic % by Zip Code (ZCTA5) — Virginia
- Population Hispanic % by Zip Code (ZCTA5) — Georgia
- Population Hispanic % by Zip Code (ZCTA5) — California
- Population Hispanic % by Zip Code (ZCTA5) — Ohio
- Population Hispanic % by Zip Code (ZCTA5) — Iowa
- Population Hispanic % by Zip Code (ZCTA5) — Utah
- Population Hispanic % by Zip Code (ZCTA5) — Wyoming
- Population Hispanic % by Zip Code (ZCTA5) — Vermont
- Population Hispanic % by Zip Code (ZCTA5) — Pennsylvania
- Population Hispanic % by Zip Code (ZCTA5) — Texas