NOTE: Gray indicates insufficient data or a suppressed estimate.
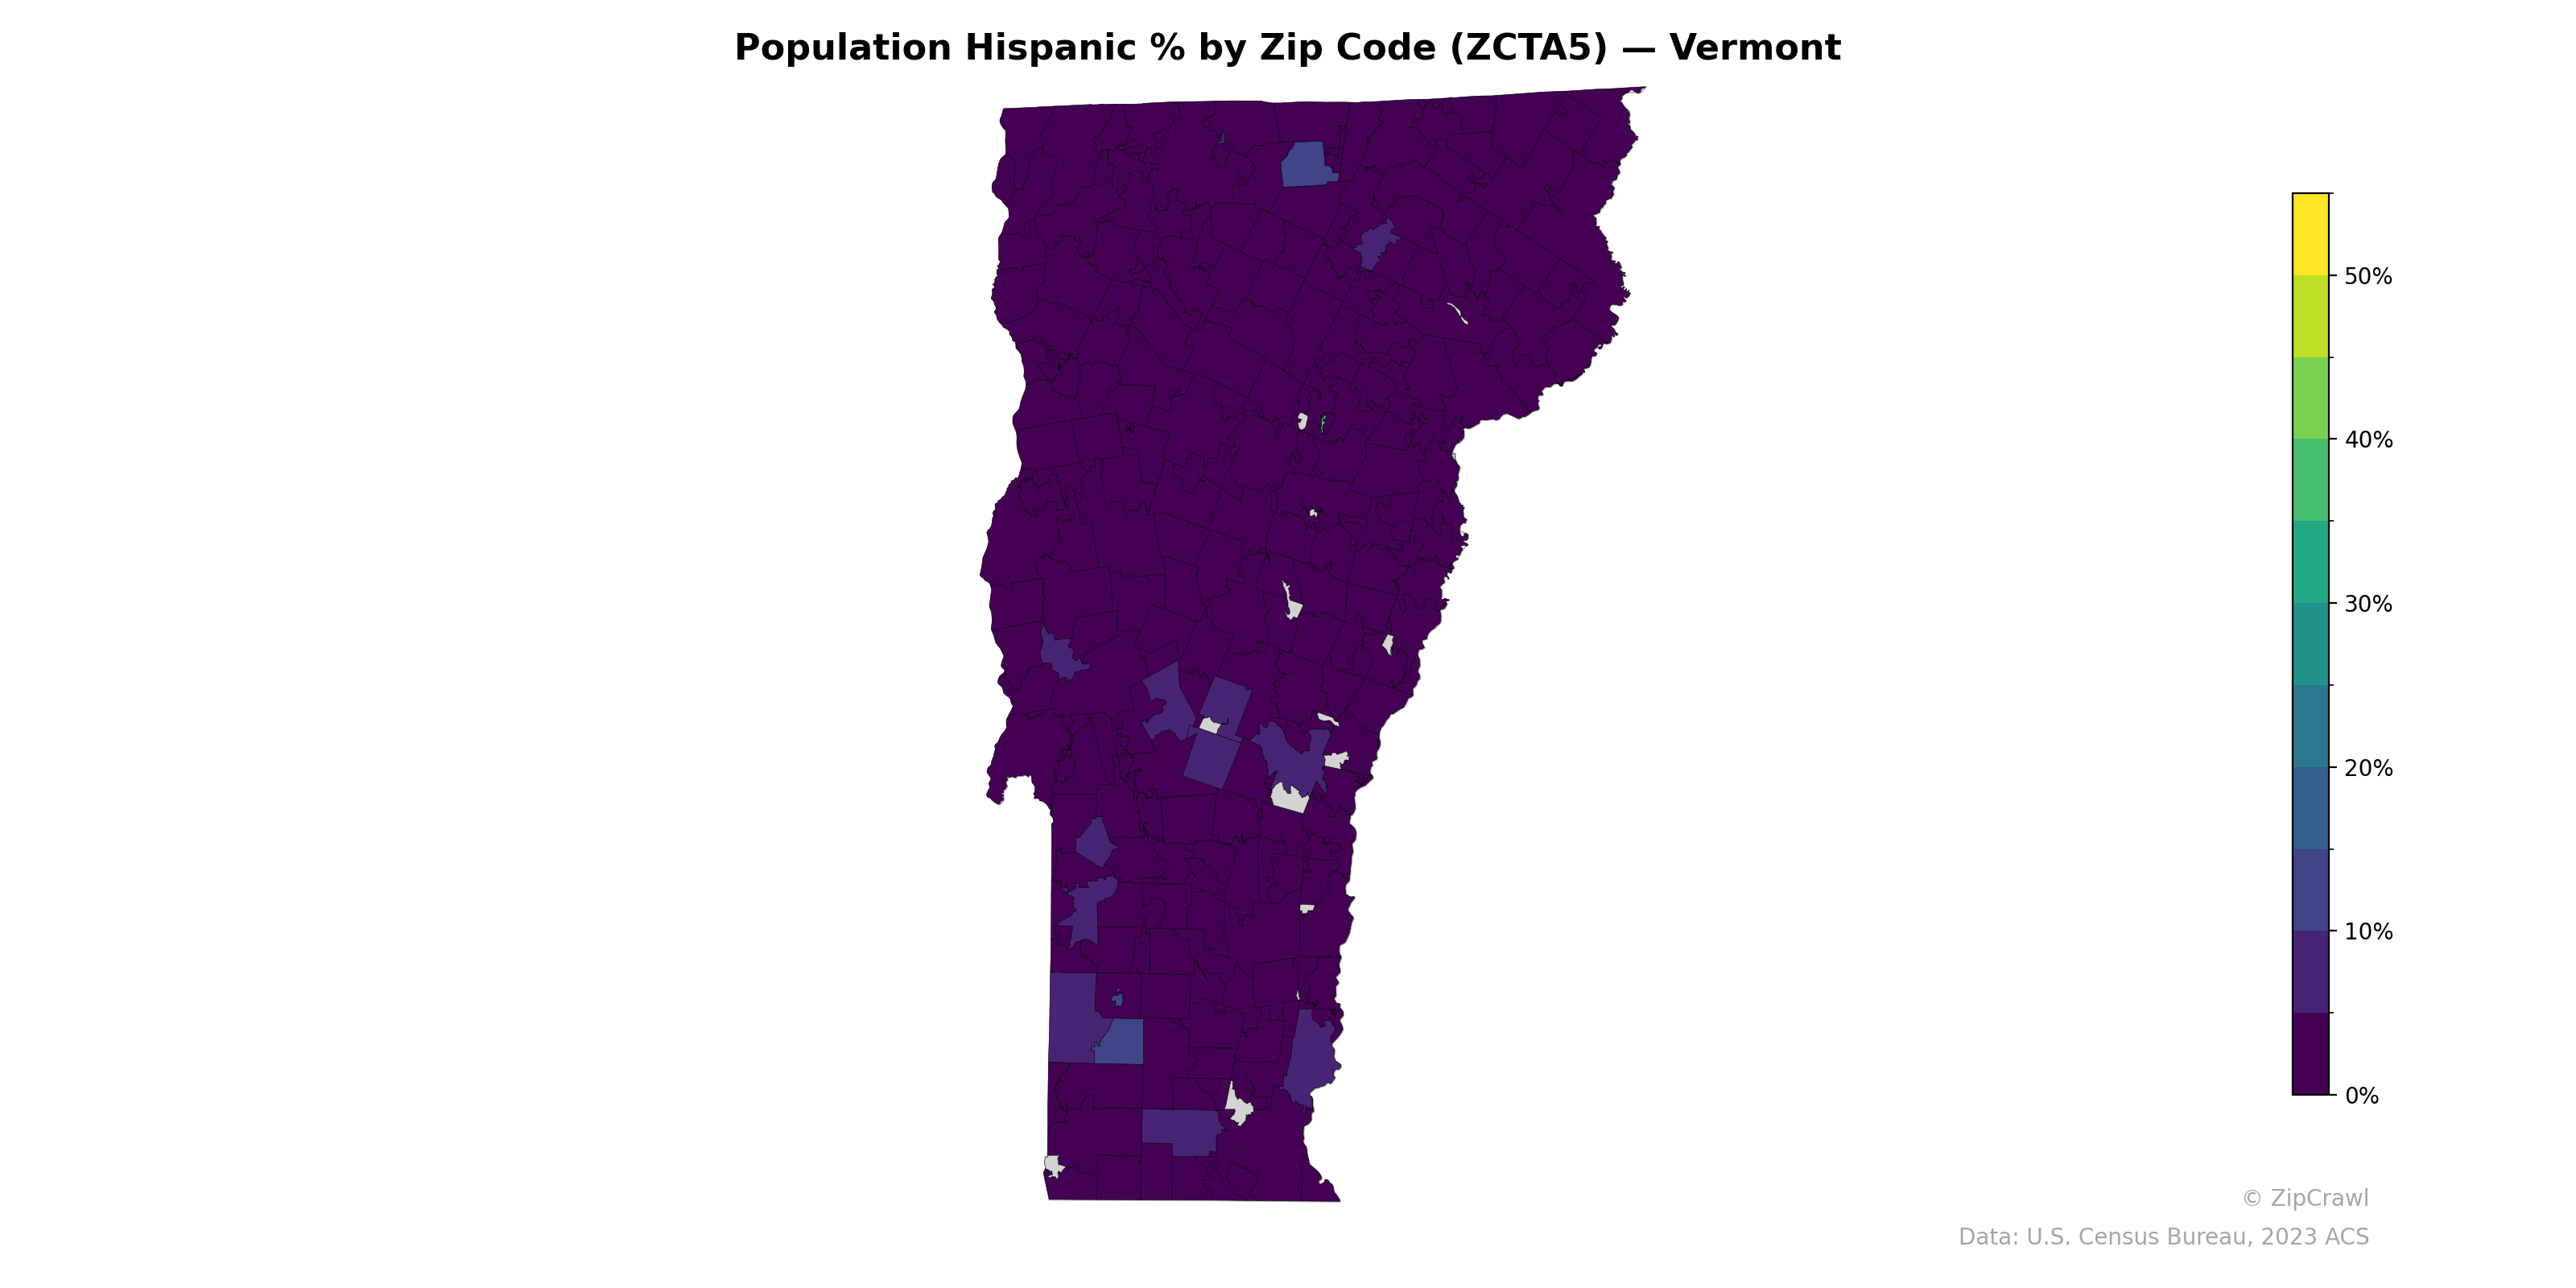
Vermont's Hispanic population percentage remains very low statewide, with the vast majority of zip codes registering below 5%, consistent with the state's demographic profile as one of the least ethnically diverse in the nation. Slightly elevated concentrations appear in scattered zip codes in the central-southern portion of the state—likely corresponding to areas around Windham and Windsor counties—as well as a few pockets in the northern region near the Canadian border, where percentages appear to reach roughly 5–10%. The overall pattern is one of remarkable demographic uniformity, with no zip code approaching the 20%+ range on the color scale.
Data: U.S. Census Bureau, 2023 ACS
Explore
- Housing Vacancy Rate by Zip Code (ZCTA5) — New York
- Married Couple (% of all Households) by Zip Code (ZCTA5) — Alaska
- Household Median Income by Zip Code (ZCTA5) — Vermont
- Population Non-Hispanic Asian % by Zip Code (ZCTA5) — Alaska
- % of Population on Food Stamps or SNAP (Last 12 Months), by Zip Code (ZCTA5) — Alaska
- Housing Vacancy Rate by Zip Code (ZCTA5) — Alaska
- U.S. Citizens (% of Population Over 18) by Zip Code (ZCTA5) — Vermont
- Population Non-Hispanic Black % by Zip Code (ZCTA5) — Vermont
- Median Age by Zip Code (ZCTA5) — Vermont
- Population Non-Hispanic White % by Zip Code (ZCTA5) — Vermont
- Household Average Size by County
- Household Average Size by Zip Code (ZCTA5) — New York
- Housing Median Monthly Rent ($), by Zip Code (ZCTA5) — New York
- Married Couple (% of all Households) by Zip Code (ZCTA5) — New York
- Housing % of Units Built Since 2010, by Zip Code (ZCTA5) — New York
- Married Couple (% of all Households) by Zip Code (ZCTA5) — Maryland
- % of Population without Health Insurance, by Zip Code (ZCTA5) — New York
- Bachelor's Degree or Higher (% of Over 25) by Zip Code (ZCTA5) — New York
- % of Households with Broadband Internet, by Zip Code (ZCTA5) — New York
- Housing Owner-Occupied % of Units, by Zip Code (ZCTA5) — New York
- Married Couple (% of all Households) by Zip Code (ZCTA5) — Pennsylvania
- Housing Owner-Occupied Median Value ($), by Zip Code (ZCTA5) — New York
- Population Non-Hispanic American Indian % by Zip Code (ZCTA5) — North Dakota
- Population Non-Hispanic Black % by Zip Code (ZCTA5) — North Dakota
- Household Average Size by Zip Code (ZCTA5) — Rhode Island
- Population Non-Hispanic American Indian % by Zip Code (ZCTA5) — Rhode Island
- Housing % of Units Built Since 2010, by Zip Code (ZCTA5) — Rhode Island
- Population Non-Hispanic Black % by Zip Code (ZCTA5) — Oregon
- Married Couple (% of all Households) by Zip Code (ZCTA5) — Rhode Island
- % of Population without Health Insurance, by Zip Code (ZCTA5) — Rhode Island
- Population Hispanic % by Zip Code (ZCTA5) — Montana
- Population Hispanic % by Zip Code (ZCTA5) — Ohio
- Population Hispanic % by Zip Code (ZCTA5) — Utah
- Population Hispanic % by Zip Code (ZCTA5) — Iowa
- Population Hispanic % by Zip Code (ZCTA5) — Texas
- Population Hispanic % by Zip Code (ZCTA5) — Maine
- Population Hispanic % by Zip Code (ZCTA5) — Oregon
- Population Hispanic % by Zip Code (ZCTA5) — Hawaii
- Population Hispanic % by Zip Code (ZCTA5) — Idaho
- Population Hispanic % by Zip Code (ZCTA5) — Virginia