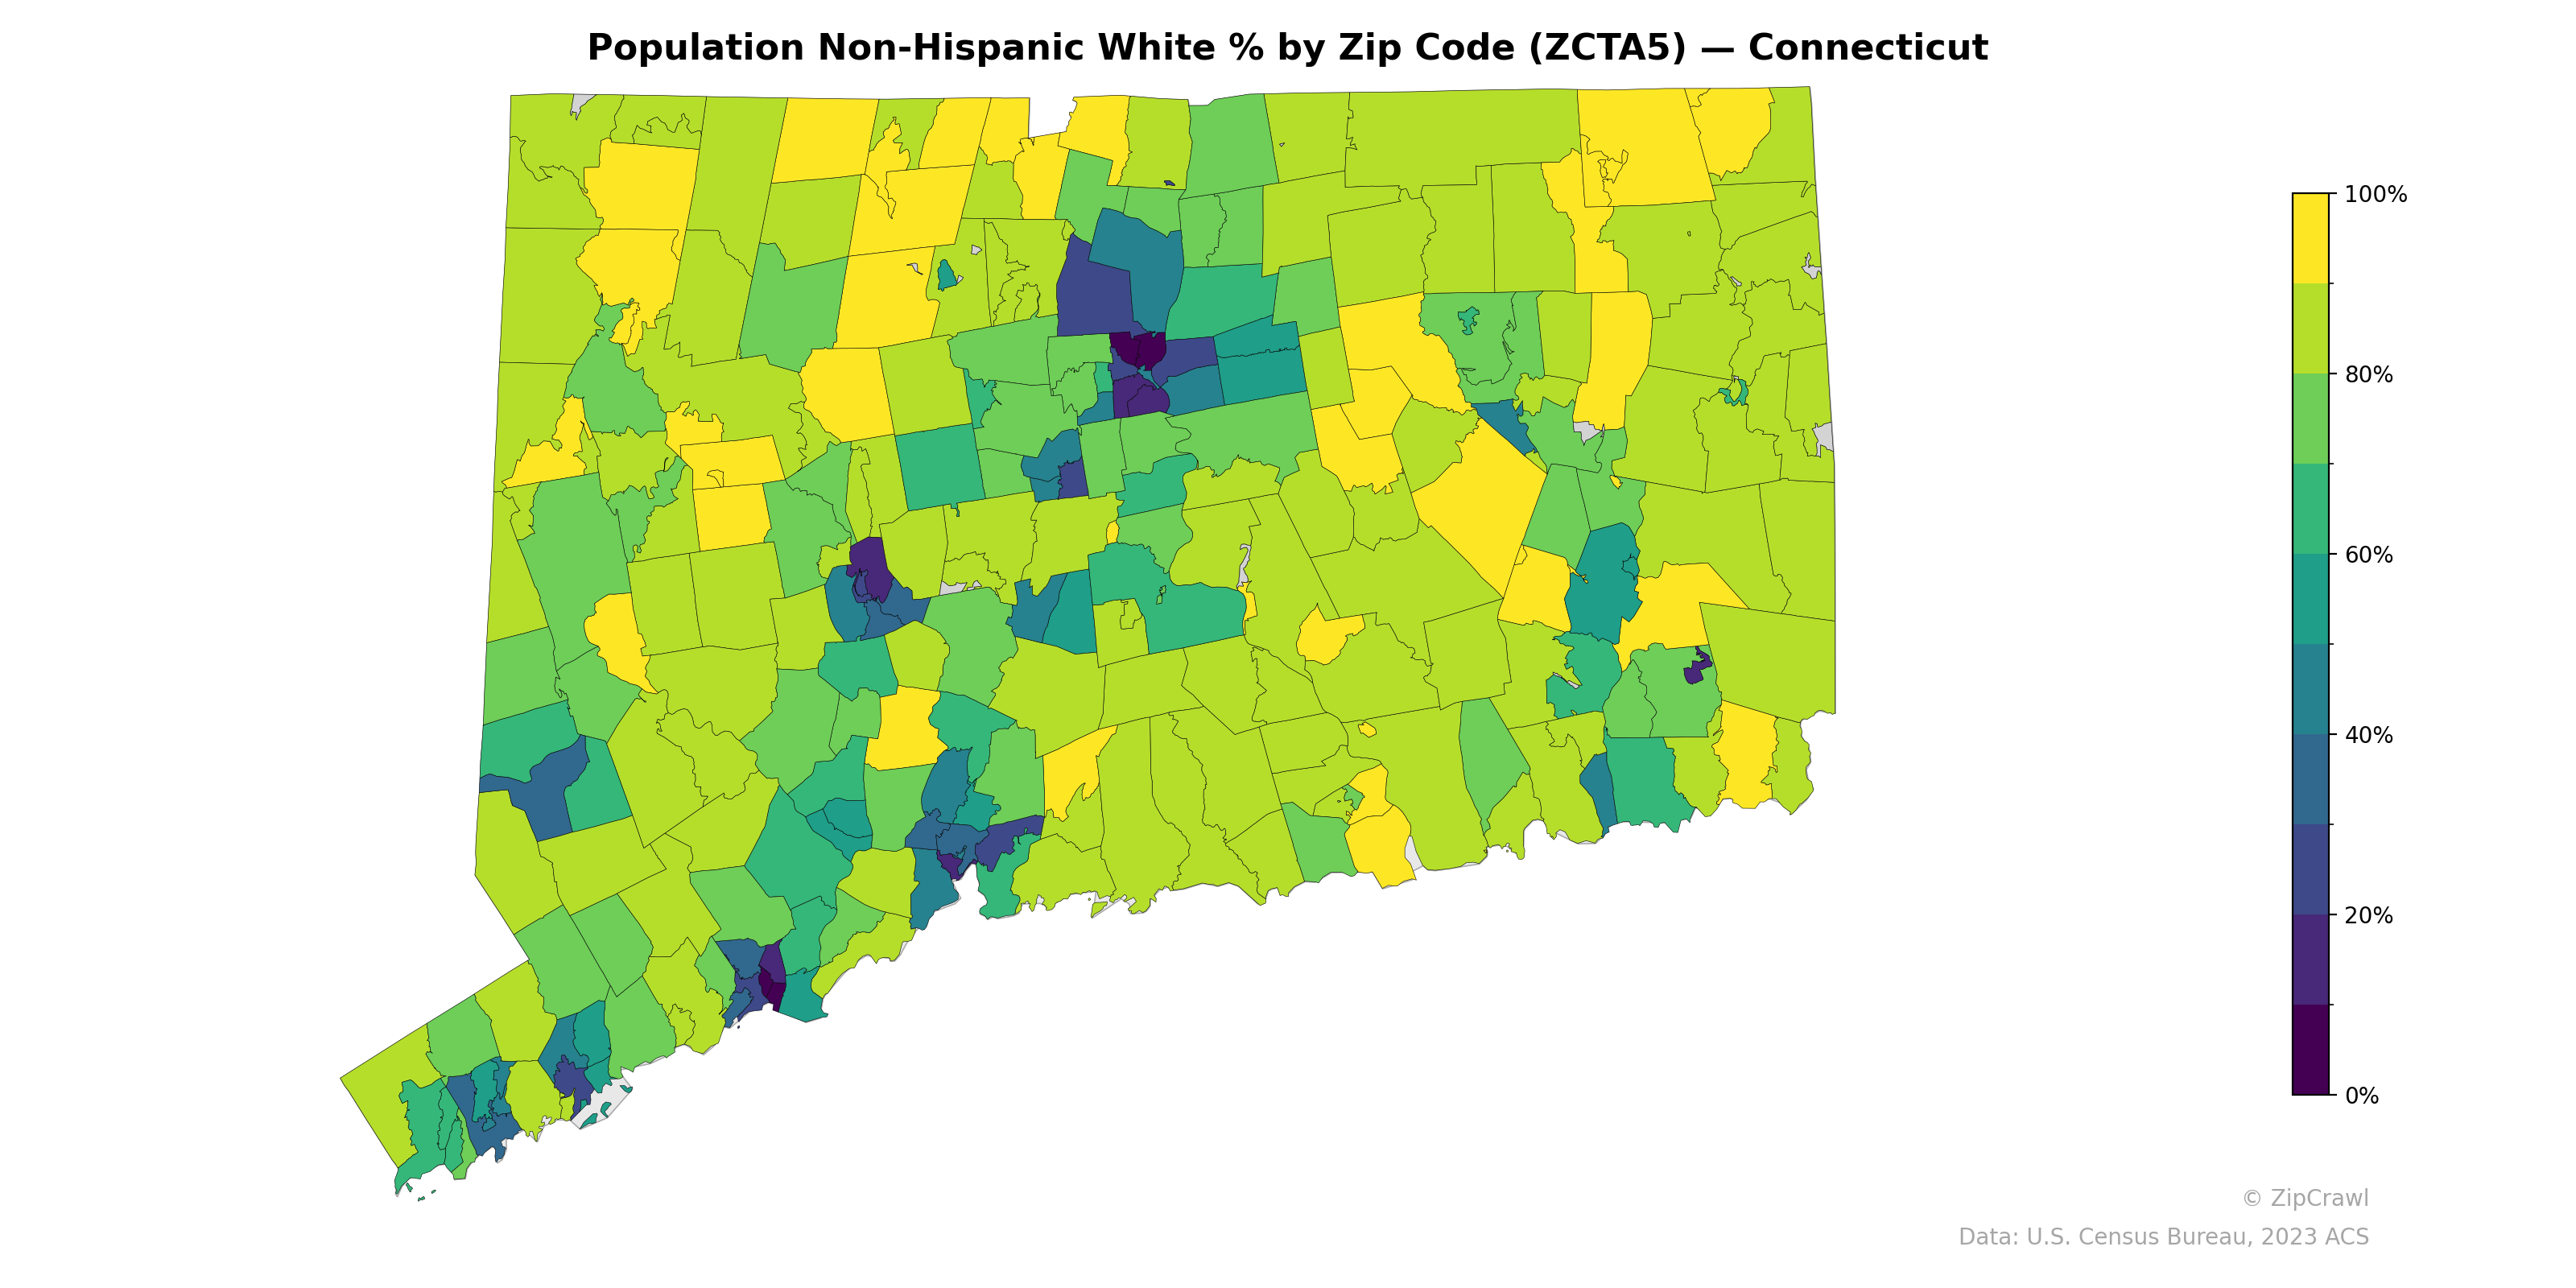
NOTE: Gray indicates insufficient data or a suppressed estimate.
Connecticut's non-Hispanic white population percentage exhibits a stark urban-suburban divide, with the lowest concentrations (below 20-40%) clustered in the state's major cities—Hartford, New Haven, Bridgeport, and Waterbury—visible as deep teal and purple zones in the central and southwestern corridors. The rural and exurban zip codes of Litchfield County in the northwest and Windham/Tolland counties in the northeast consistently register above 80-90%, creating a yellow-green periphery that contrasts sharply with the diverse urban cores. Fairfield County along the southwestern coast displays notable heterogeneity, with affluent suburban zip codes at 70-90% sitting adjacent to Bridgeport and Stamford zip codes that drop well below 40%.
Data: U.S. Census Bureau, 2023 ACS
Explore
- Household Average Size by Zip Code (ZCTA5) — Pennsylvania
- Housing Vacancy Rate by Zip Code (ZCTA5) — California
- % of Population on Food Stamps or SNAP (Last 12 Months), by Zip Code (ZCTA5) — Oklahoma
- Population Hispanic % by Zip Code (ZCTA5) — Connecticut
- Population Non-Hispanic Asian % by Zip Code (ZCTA5) — Oklahoma
- Housing Vacancy Rate by Zip Code (ZCTA5) — Oklahoma
- Population Non-Hispanic Black % by Zip Code (ZCTA5) — Connecticut
- Married Couple (% of all Households) by Zip Code (ZCTA5) — Oklahoma
- Household Median Income by Zip Code (ZCTA5) — Connecticut
- Median Age by Zip Code (ZCTA5) — Connecticut
- U.S. Citizens (% of Population Over 18) by Zip Code (ZCTA5) — Connecticut
- Housing Owner-Occupied % of Units, by County
- Housing Median Monthly Rent ($), by Zip Code (ZCTA5) — California
- Housing Owner-Occupied Median Value ($), by Zip Code (ZCTA5) — California
- Housing % of Units Built Since 2010, by Zip Code (ZCTA5) — California
- % of Population without Health Insurance, by Zip Code (ZCTA5) — California
- Housing Owner-Occupied % of Units, by Zip Code (ZCTA5) — California
- Bachelor's Degree or Higher (% of Over 25) by Zip Code (ZCTA5) — California
- % of Households with Broadband Internet, by Zip Code (ZCTA5) — California
- Household Average Size by Zip Code (ZCTA5) — California
- Married Couple (% of all Households) by Zip Code (ZCTA5) — California
- Housing % of Units Built Since 2010, by Zip Code (ZCTA5) — Oregon
- Household Average Size by Zip Code (ZCTA5) — Oregon
- Median Age by Zip Code (ZCTA5) — Oregon
- Population Hispanic % by Zip Code (ZCTA5) — Oregon
- Population Non-Hispanic American Indian % by Zip Code (ZCTA5) — Oregon
- Population Non-Hispanic Black % by Zip Code (ZCTA5) — Oregon
- Housing Median Monthly Rent ($), by Zip Code (ZCTA5) — Oregon
- Married Couple (% of all Households) by Zip Code (ZCTA5) — Oregon
- % of Population without Health Insurance, by Zip Code (ZCTA5) — Oregon
- Population Non-Hispanic White % by Zip Code (ZCTA5) — Iowa
- Population Non-Hispanic White % by Zip Code (ZCTA5) — Ohio
- Population Non-Hispanic White % by Zip Code (ZCTA5) — Utah
- Population Non-Hispanic White % by Zip Code (ZCTA5) — Maine
- Population Non-Hispanic White % by Zip Code (ZCTA5) — Idaho
- Population Non-Hispanic White % by Zip Code (ZCTA5) — Texas
- Population Non-Hispanic White % by Zip Code (ZCTA5) — Nevada
- Population Non-Hispanic White % by Zip Code (ZCTA5) — Hawaii
- Population Non-Hispanic White % by Zip Code (ZCTA5) — Oregon
- Population Non-Hispanic White % by Zip Code (ZCTA5) — Wisconsin