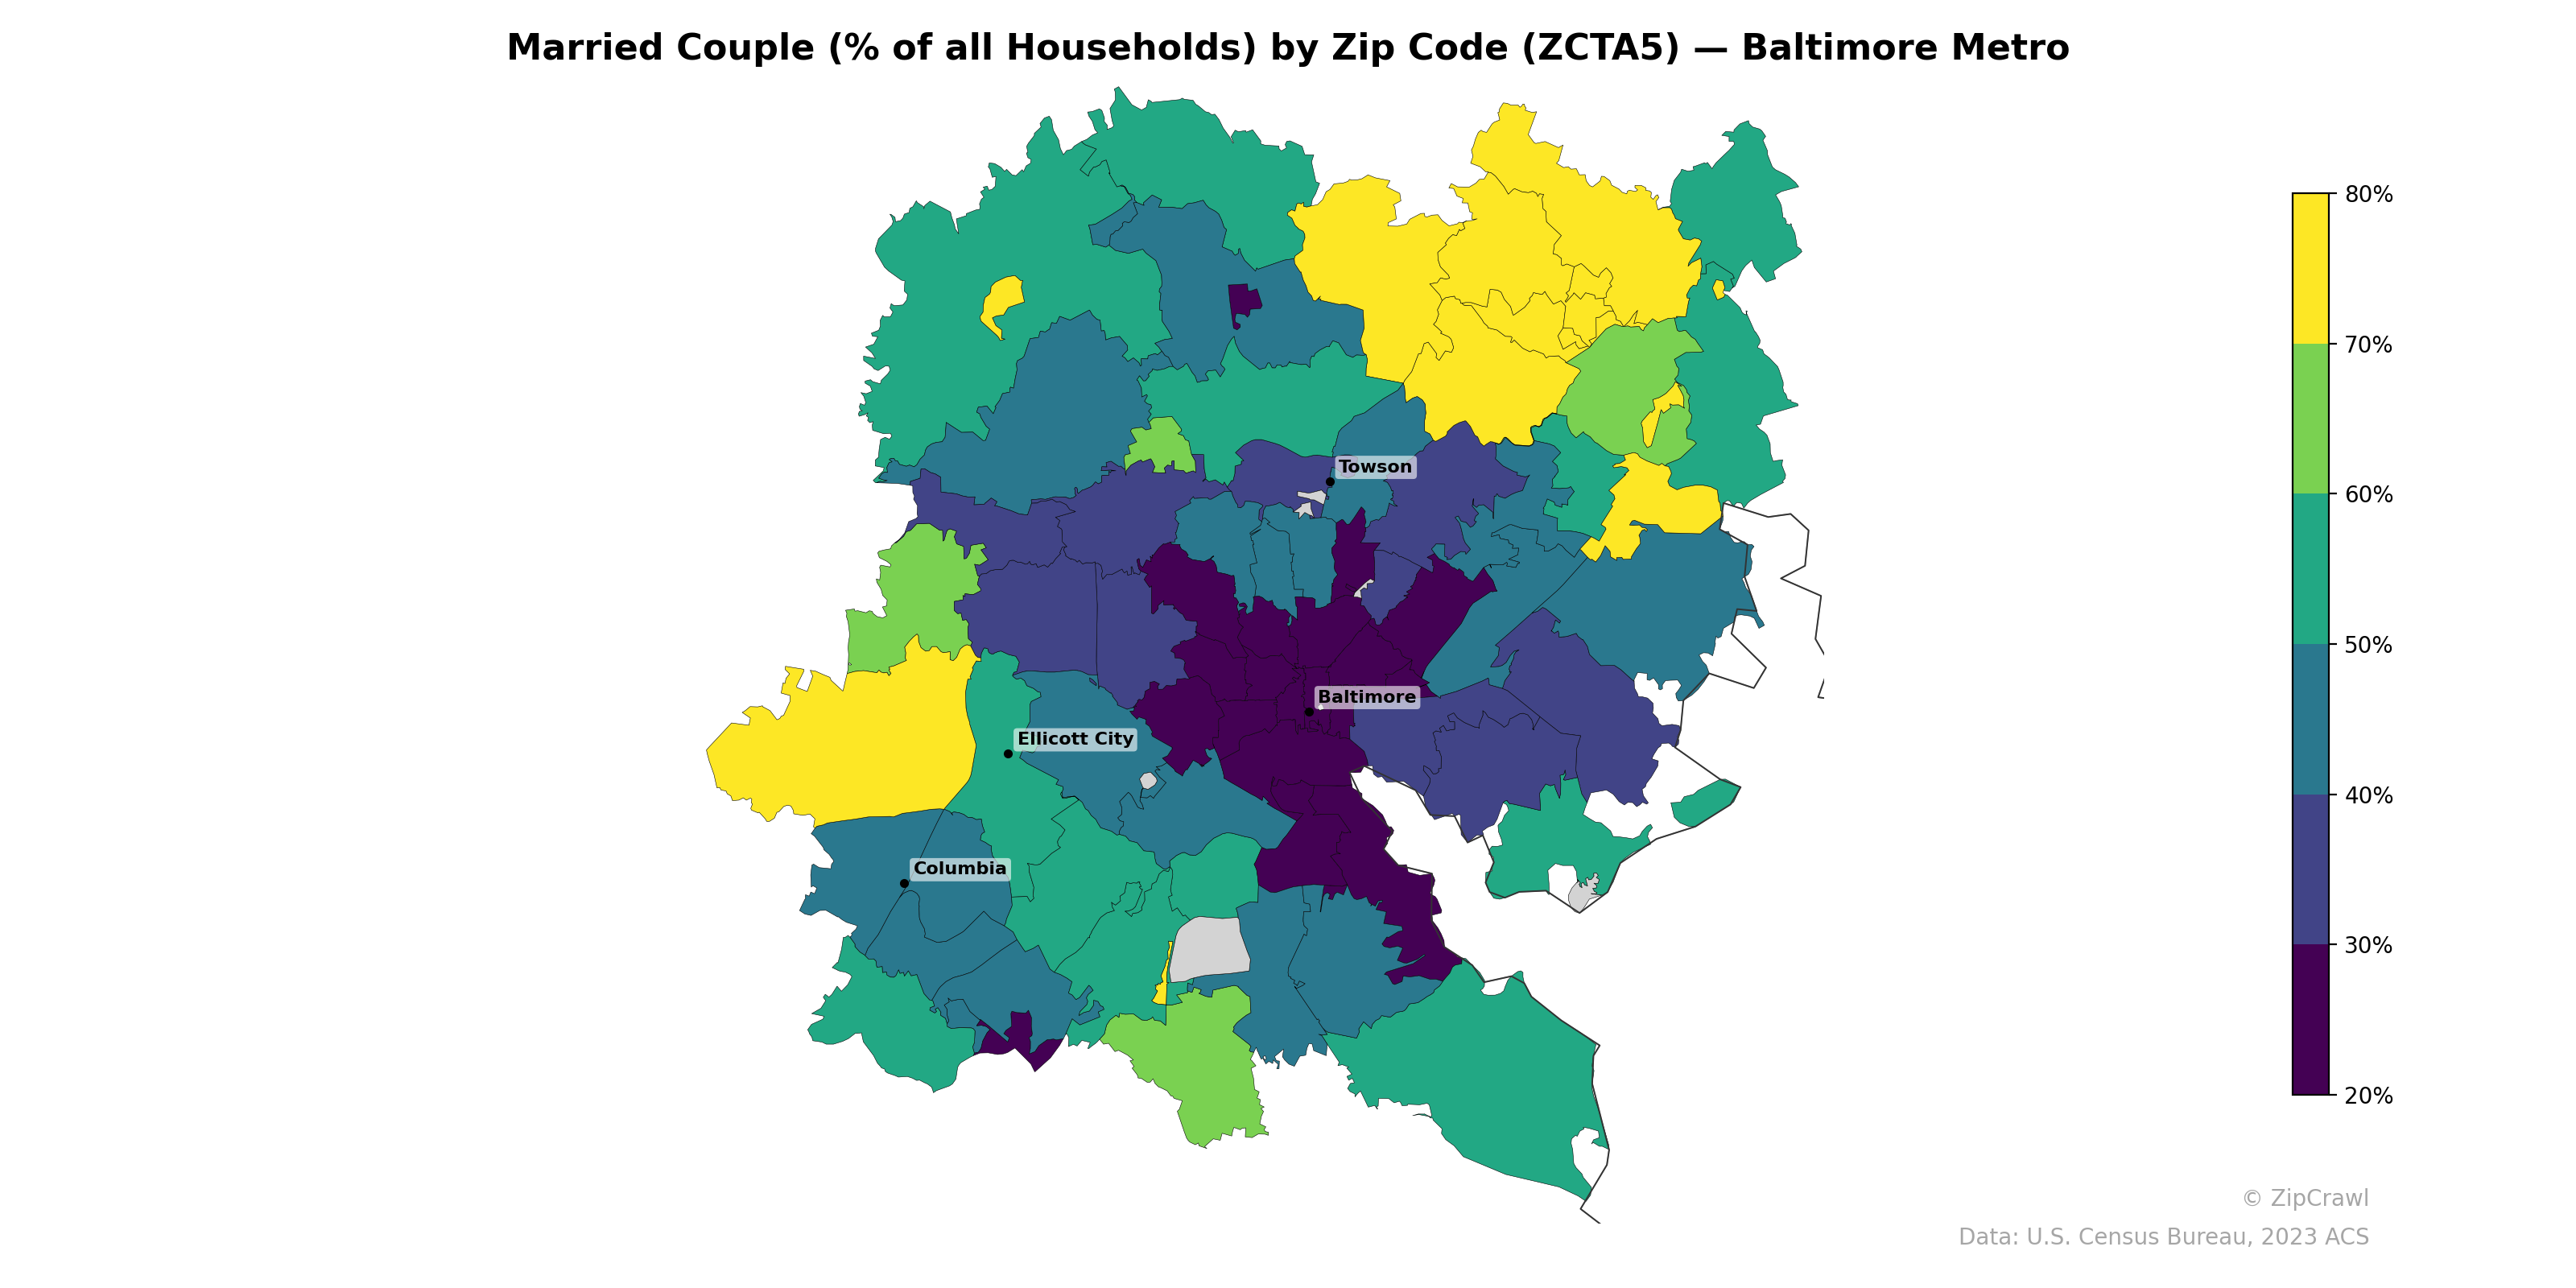
NOTE: Gray indicates insufficient data or a suppressed estimate.
Married-couple households concentrate most heavily in the outer northern and northwestern suburbs, where several zip codes exceed 70–80%, while Baltimore City's core zip codes consistently fall below 30%, creating a stark urban-suburban divide. Ellicott City and Columbia in Howard County maintain moderately high rates in the 50–65% range, forming a secondary cluster of married-couple households to the southwest. The eastern and southeastern portions of the metro display more variability, with pockets of higher rates adjacent to zip codes dropping sharply near the city boundary.
Data: U.S. Census Bureau, 2023 ACS
Explore
- % of Population on Food Stamps or SNAP (Last 12 Months), by Zip Code (ZCTA5) — Chicago Metro
- Bachelor's Degree or Higher (% of Over 25) by Zip Code (ZCTA5) — Baltimore Metro
- Housing Owner-Occupied Median Value ($), by Zip Code (ZCTA5) — Baltimore Metro
- Housing Median Monthly Rent ($), by Zip Code (ZCTA5) — Baltimore Metro
- Housing Vacancy Rate by Zip Code (ZCTA5) — Baltimore Metro
- % of Households with Broadband Internet, by Zip Code (ZCTA5) — Baltimore Metro
- Housing % of Units Built Since 2010, by Zip Code (ZCTA5) — Baltimore Metro
- % of Population without Health Insurance, by Zip Code (ZCTA5) — Baltimore Metro
- Household Average Size by Zip Code (ZCTA5) — Baltimore Metro
- Housing Owner-Occupied % of Units, by Zip Code (ZCTA5) — Baltimore Metro
- High School Graduate (% of Over 25) by County
- Population Non-Hispanic White % by Zip Code (ZCTA5) — Texas
- U.S. Citizens (% of Population Over 18) by Zip Code (ZCTA5) — Texas
- Population Non-Hispanic Asian % by Zip Code (ZCTA5) — Chicago Metro
- Household Median Income by Zip Code (ZCTA5) — Texas
- High School Graduate (% of Over 25) by Zip Code (ZCTA5) — Texas
- Population Hispanic % by Zip Code (ZCTA5) — Texas
- Median Age by Zip Code (ZCTA5) — Texas
- Population Non-Hispanic Black % by Zip Code (ZCTA5) — Texas
- Housing % of Units Built Since 2010, by County
- Population Non-Hispanic American Indian % by Zip Code (ZCTA5) — Texas
- High School Graduate (% of Over 25) by Zip Code (ZCTA5) — Baltimore Metro
- % of Population on Food Stamps or SNAP (Last 12 Months), by Zip Code (ZCTA5) — Charlotte Metro
- Household Median Income by Zip Code (ZCTA5) — Baltimore Metro
- Population Non-Hispanic American Indian % by Zip Code (ZCTA5) — Baltimore Metro
- Population Non-Hispanic Black % by Zip Code (ZCTA5) — Baltimore Metro
- Population Non-Hispanic Asian % by Zip Code (ZCTA5) — Baltimore Metro
- U.S. Citizens (% of Population Over 18) by Zip Code (ZCTA5) — Baltimore Metro
- Population Hispanic % by Zip Code (ZCTA5) — Minnesota
- Population Hispanic % by Zip Code (ZCTA5) — Baltimore Metro
- Married Couple (% of all Households) by Zip Code (ZCTA5) — Houston Metro
- Married Couple (% of all Households) by Zip Code (ZCTA5) — Miami Metro
- Married Couple (% of all Households) by Zip Code (ZCTA5) — Dallas Metro
- Married Couple (% of all Households) by Zip Code (ZCTA5) — Boston Metro
- Married Couple (% of all Households) by Zip Code (ZCTA5) — Tampa Metro
- Married Couple (% of all Households) by Zip Code (ZCTA5) — Austin Metro
- Married Couple (% of all Households) by Zip Code (ZCTA5) — Detroit Metro
- Married Couple (% of all Households) by Zip Code (ZCTA5) — Atlanta Metro
- Married Couple (% of all Households) by Zip Code (ZCTA5) — Chicago Metro
- Married Couple (% of all Households) by Zip Code (ZCTA5) — Seattle Metro