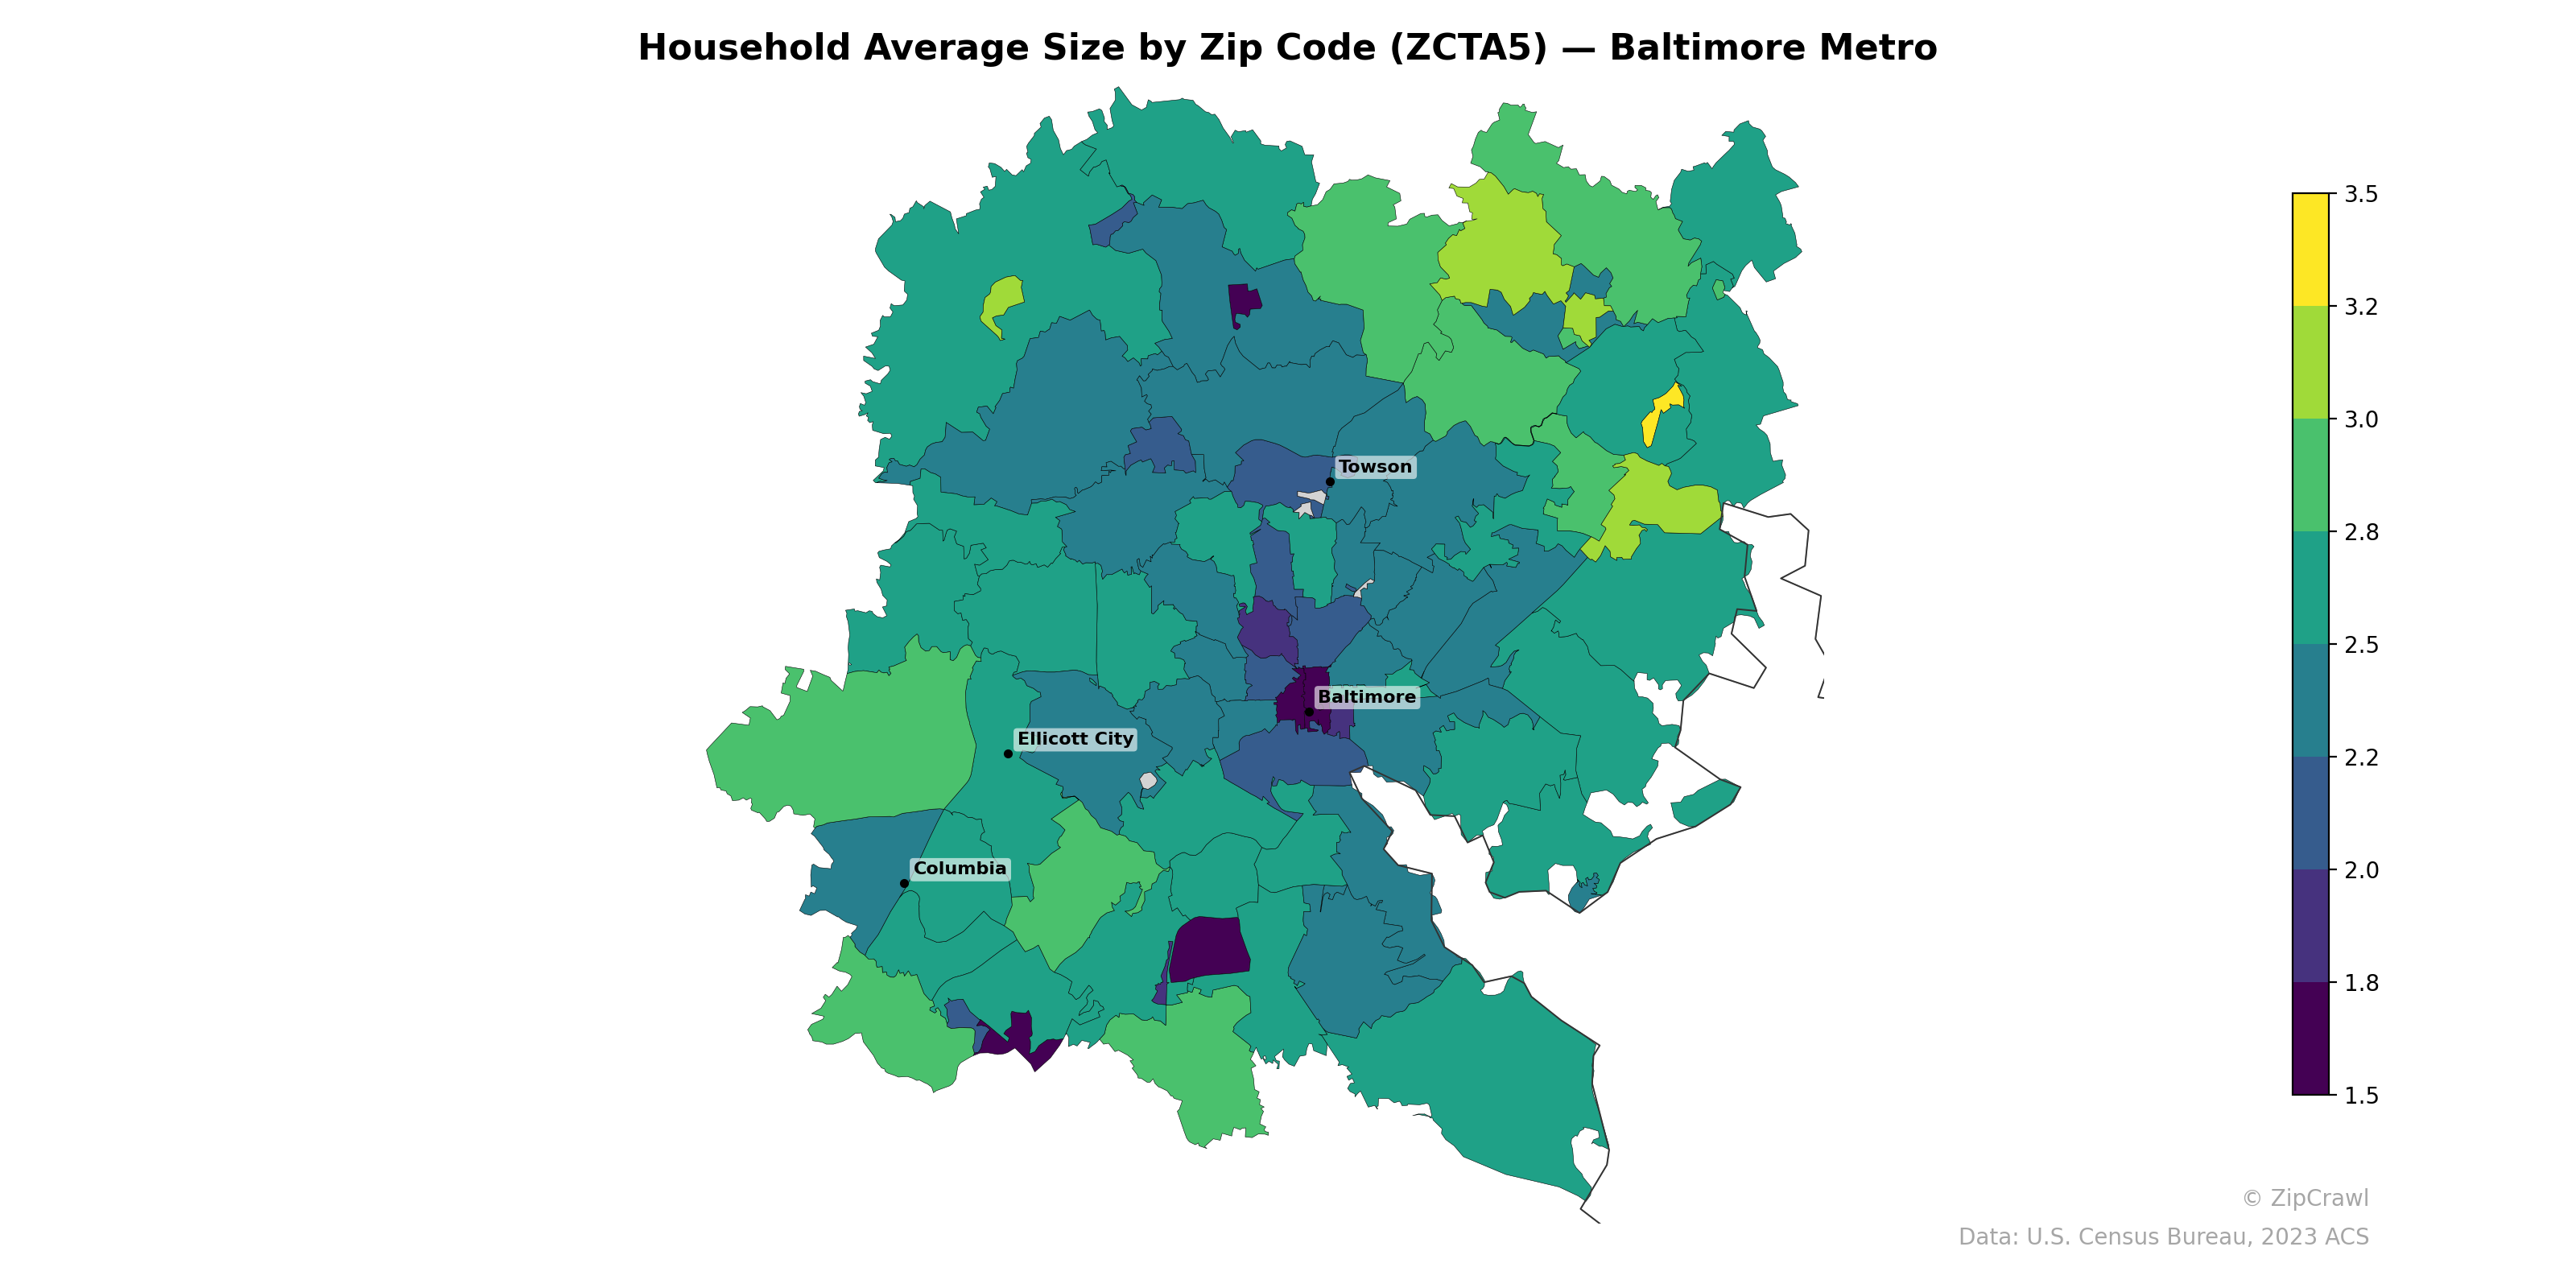
NOTE: Gray indicates insufficient data or a suppressed estimate.
Household sizes in the Baltimore metro area follow a clear urban-suburban gradient, with the smallest averages (1.5–2.0 persons) concentrated in downtown Baltimore and its immediately surrounding zip codes, likely reflecting higher shares of single-person and non-family households. The largest household sizes (3.0–3.5+) cluster in the outer northern and northeastern suburban zip codes, as well as in portions of the southwest near Columbia and Ellicott City, consistent with family-oriented suburban development. A notable contrast exists on the eastern side of the metro, where pockets of higher household size appear adjacent to zip codes with markedly lower averages, suggesting sharp demographic transitions across relatively short distances.
Data: U.S. Census Bureau, 2023 ACS
Explore
- % of Population on Food Stamps or SNAP (Last 12 Months), by Zip Code (ZCTA5) — Chicago Metro
- Bachelor's Degree or Higher (% of Over 25) by Zip Code (ZCTA5) — Baltimore Metro
- Housing Owner-Occupied Median Value ($), by Zip Code (ZCTA5) — Baltimore Metro
- Housing Median Monthly Rent ($), by Zip Code (ZCTA5) — Baltimore Metro
- Housing Vacancy Rate by Zip Code (ZCTA5) — Baltimore Metro
- % of Households with Broadband Internet, by Zip Code (ZCTA5) — Baltimore Metro
- Housing % of Units Built Since 2010, by Zip Code (ZCTA5) — Baltimore Metro
- Housing Owner-Occupied % of Units, by Zip Code (ZCTA5) — Baltimore Metro
- Married Couple (% of all Households) by Zip Code (ZCTA5) — Baltimore Metro
- % of Population without Health Insurance, by Zip Code (ZCTA5) — Baltimore Metro
- High School Graduate (% of Over 25) by County
- Population Non-Hispanic White % by Zip Code (ZCTA5) — Texas
- U.S. Citizens (% of Population Over 18) by Zip Code (ZCTA5) — Texas
- Population Non-Hispanic Asian % by Zip Code (ZCTA5) — Chicago Metro
- Household Median Income by Zip Code (ZCTA5) — Texas
- High School Graduate (% of Over 25) by Zip Code (ZCTA5) — Texas
- Population Hispanic % by Zip Code (ZCTA5) — Texas
- Median Age by Zip Code (ZCTA5) — Texas
- Population Non-Hispanic Black % by Zip Code (ZCTA5) — Texas
- Population Non-Hispanic Asian % by County
- Population Non-Hispanic American Indian % by Zip Code (ZCTA5) — Texas
- High School Graduate (% of Over 25) by Zip Code (ZCTA5) — Baltimore Metro
- % of Population on Food Stamps or SNAP (Last 12 Months), by Zip Code (ZCTA5) — Charlotte Metro
- Household Median Income by Zip Code (ZCTA5) — Baltimore Metro
- Population Non-Hispanic American Indian % by Zip Code (ZCTA5) — Baltimore Metro
- Population Non-Hispanic Black % by Zip Code (ZCTA5) — Baltimore Metro
- Population Non-Hispanic Asian % by Zip Code (ZCTA5) — Baltimore Metro
- U.S. Citizens (% of Population Over 18) by Zip Code (ZCTA5) — Baltimore Metro
- Median Age by Zip Code (ZCTA5) — St. Louis Metro
- Population Non-Hispanic White % by Zip Code (ZCTA5) — Minnesota
- Household Average Size by Zip Code (ZCTA5) — Houston Metro
- Household Average Size by Zip Code (ZCTA5) — Miami Metro
- Household Average Size by Zip Code (ZCTA5) — Detroit Metro
- Household Average Size by Zip Code (ZCTA5) — Austin Metro
- Household Average Size by Zip Code (ZCTA5) — Tampa Metro
- Household Average Size by Zip Code (ZCTA5) — Denver Metro
- Household Average Size by Zip Code (ZCTA5) — Boston Metro
- Household Average Size by Zip Code (ZCTA5) — Chicago Metro
- Household Average Size by Zip Code (ZCTA5) — Atlanta Metro
- Household Average Size by Zip Code (ZCTA5) — Dallas Metro