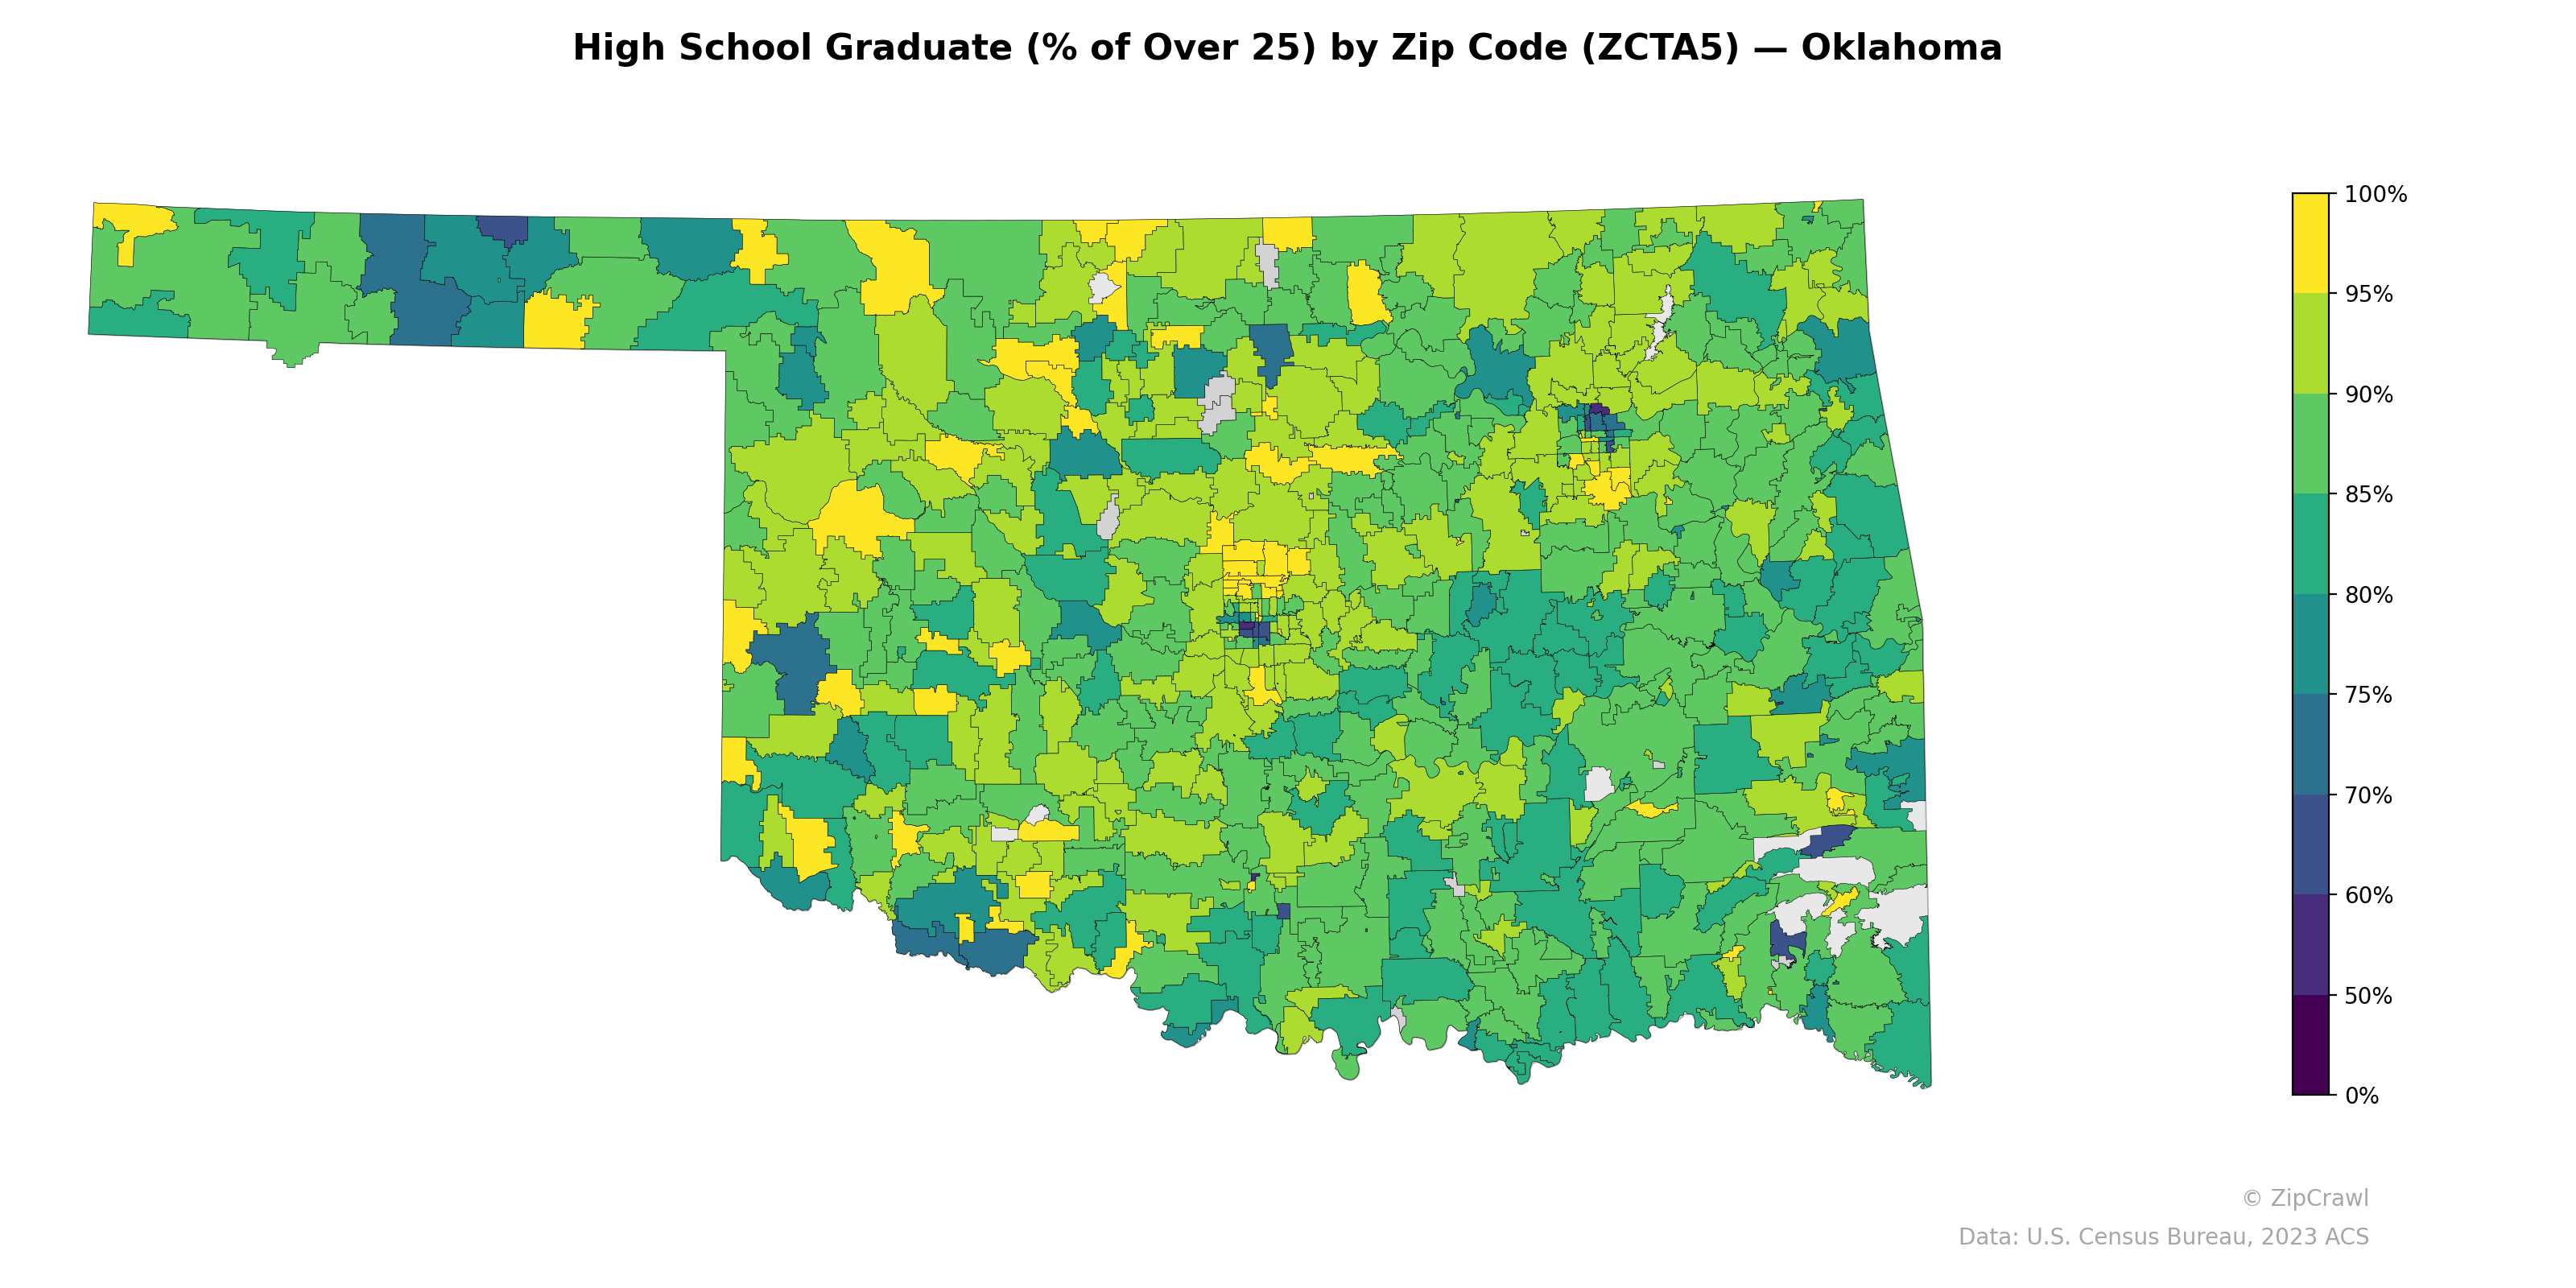
NOTE: Gray indicates insufficient data or a suppressed estimate.
High school graduation rates across Oklahoma zip codes generally range from 75% to 95%, with notable pockets of lower attainment concentrated in the southeastern corner of the state and parts of the Oklahoma City metro core, where some zip codes dip below 60%. The northwestern panhandle region and several rural areas in western Oklahoma also display comparatively lower rates, appearing in darker teal shades, likely reflecting communities with higher immigrant or Native American populations. Suburban zip codes ringing Oklahoma City and Tulsa consistently show the highest graduation rates at 90–100%, forming bright yellow clusters that contrast sharply with their adjacent urban cores.
Data: U.S. Census Bureau, 2023 ACS
Explore
- Married Couple (% of all Households) by Zip Code (ZCTA5) — California
- % of Population on Food Stamps or SNAP (Last 12 Months), by Zip Code (ZCTA5) — Illinois
- % of Population without Health Insurance, by Zip Code (ZCTA5) — Oklahoma
- Housing Owner-Occupied Median Value ($), by Zip Code (ZCTA5) — Oklahoma
- % of Households with Broadband Internet, by Zip Code (ZCTA5) — Oklahoma
- Population Non-Hispanic American Indian % by Zip Code (ZCTA5) — Oklahoma
- Housing Owner-Occupied % of Units, by Zip Code (ZCTA5) — Oklahoma
- Bachelor's Degree or Higher (% of Over 25) by Zip Code (ZCTA5) — Oklahoma
- Housing % of Units Built Since 2010, by Zip Code (ZCTA5) — Oklahoma
- Housing Median Monthly Rent ($), by Zip Code (ZCTA5) — Oklahoma
- Household Average Size by Zip Code (ZCTA5) — Oklahoma
- Housing Owner-Occupied % of Units, by County
- Housing Owner-Occupied % of Units, by Zip Code (ZCTA5) — California
- Housing Owner-Occupied Median Value ($), by Zip Code (ZCTA5) — California
- Housing Median Monthly Rent ($), by Zip Code (ZCTA5) — California
- Housing % of Units Built Since 2010, by Zip Code (ZCTA5) — California
- Bachelor's Degree or Higher (% of Over 25) by Zip Code (ZCTA5) — California
- % of Population without Health Insurance, by Zip Code (ZCTA5) — California
- % of Households with Broadband Internet, by Zip Code (ZCTA5) — California
- Housing Vacancy Rate by Zip Code (ZCTA5) — California
- Household Average Size by Zip Code (ZCTA5) — California
- Housing % of Units Built Since 2010, by Zip Code (ZCTA5) — Oregon
- Household Average Size by Zip Code (ZCTA5) — Oregon
- Population Non-Hispanic White % by Zip Code (ZCTA5) — Oregon
- Housing Owner-Occupied Median Value ($), by Zip Code (ZCTA5) — Oregon
- Population Hispanic % by Zip Code (ZCTA5) — Oregon
- Population Non-Hispanic Black % by Zip Code (ZCTA5) — Oregon
- Housing Median Monthly Rent ($), by Zip Code (ZCTA5) — Oregon
- Married Couple (% of all Households) by Zip Code (ZCTA5) — Oregon
- U.S. Citizens (% of Population Over 18) by Zip Code (ZCTA5) — Oregon
- High School Graduate (% of Over 25) by Zip Code (ZCTA5) — Idaho
- High School Graduate (% of Over 25) by Zip Code (ZCTA5) — Ohio
- High School Graduate (% of Over 25) by Zip Code (ZCTA5) — Utah
- High School Graduate (% of Over 25) by Zip Code (ZCTA5) — Iowa
- High School Graduate (% of Over 25) by Zip Code (ZCTA5) — Alabama
- High School Graduate (% of Over 25) by Zip Code (ZCTA5) — Colorado
- High School Graduate (% of Over 25) by Zip Code (ZCTA5) — Texas
- High School Graduate (% of Over 25) by Zip Code (ZCTA5) — Hawaii
- High School Graduate (% of Over 25) by Zip Code (ZCTA5) — Oregon
- High School Graduate (% of Over 25) by Zip Code (ZCTA5) — Maine