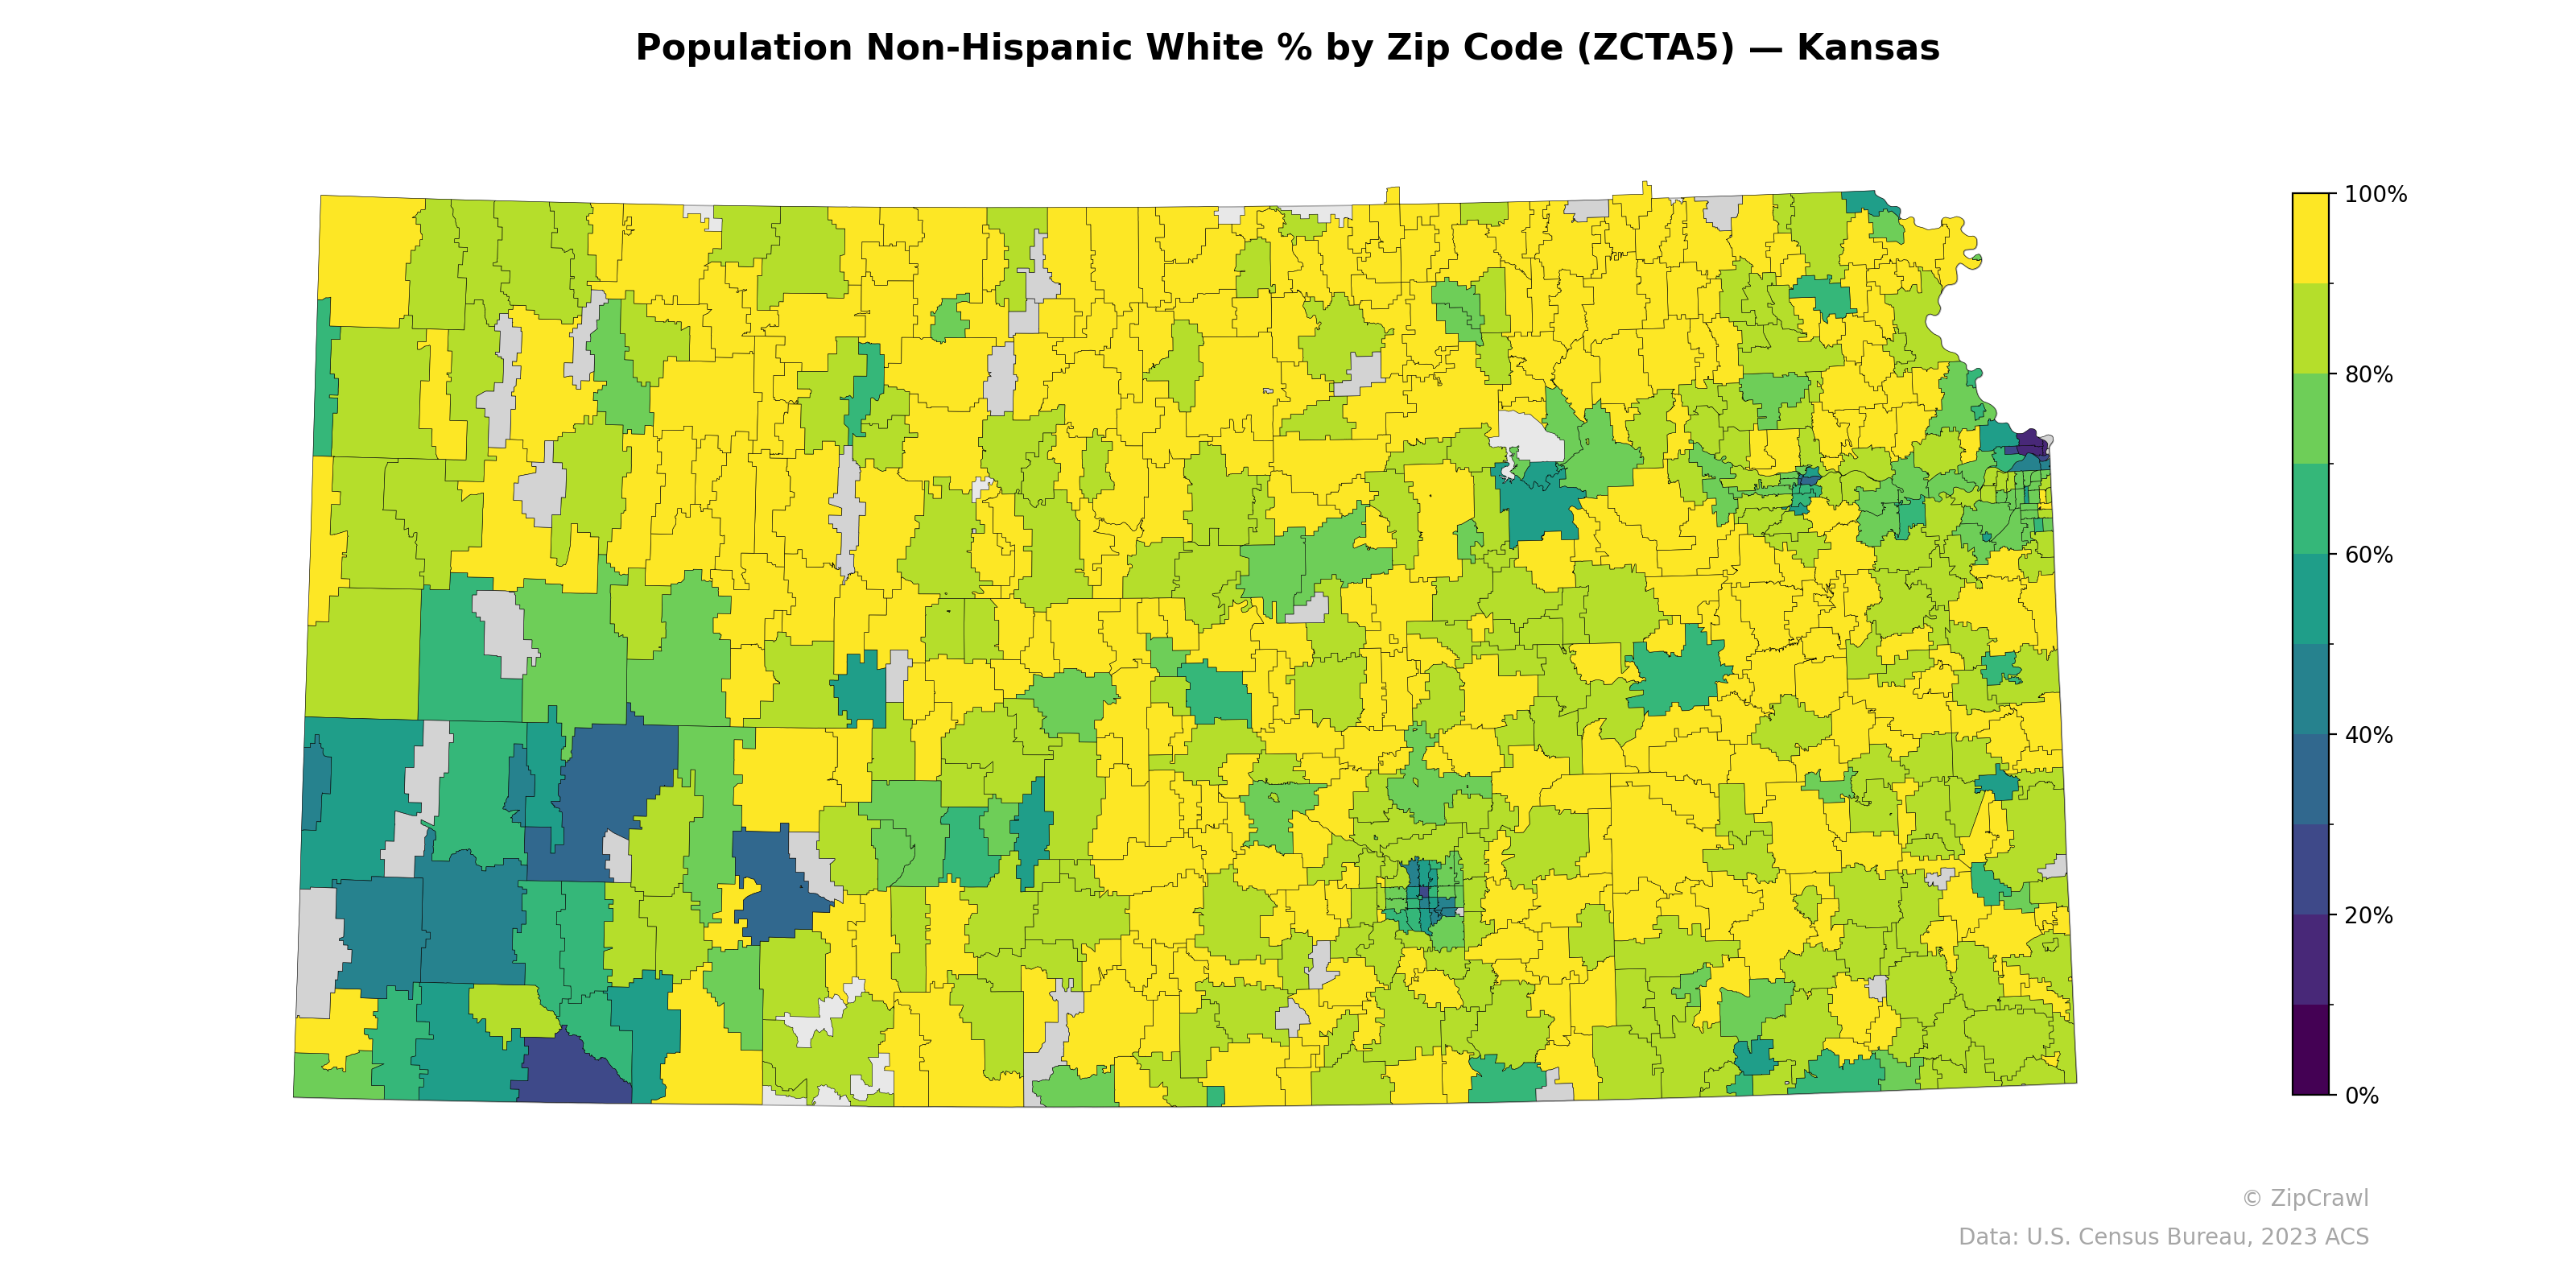
NOTE: Gray indicates insufficient data or a suppressed estimate.
Rural western and central Kansas zip codes predominantly display non-Hispanic white percentages above 80%, with notable exceptions in the southwest corner—likely corresponding to meatpacking communities such as Garden City, Dodge City, and Liberal—where percentages drop below 40%. The Kansas City metropolitan area on the eastern border and the Wichita area in south-central Kansas exhibit the most pronounced intra-urban variation, with some zip codes falling below 20%, reflecting the racial and ethnic diversity concentrated in the state's largest population centers. A secondary band of moderate diversity (60–80%) extends across north-central Kansas, distinguishing it from the otherwise homogeneous rural landscape.
Data: U.S. Census Bureau, 2023 ACS
Explore
- % of Households with Broadband Internet, by Zip Code (ZCTA5) — Florida
- % of Population on Food Stamps or SNAP (Last 12 Months), by Zip Code (ZCTA5) — Mississippi
- Population Hispanic % by Zip Code (ZCTA5) — Kansas
- Median Age by Zip Code (ZCTA5) — Kansas
- Housing Vacancy Rate by Zip Code (ZCTA5) — Mississippi
- Household Median Income by Zip Code (ZCTA5) — Kansas
- Married Couple (% of all Households) by Zip Code (ZCTA5) — Mississippi
- Population Non-Hispanic Asian % by Zip Code (ZCTA5) — Mississippi
- Population Non-Hispanic Black % by Zip Code (ZCTA5) — Kansas
- U.S. Citizens (% of Population Over 18) by Zip Code (ZCTA5) — Kansas
- Housing Median Monthly Rent ($), by County
- Population Non-Hispanic Asian % by County
- Married Couple (% of all Households) by Zip Code (ZCTA5) — Florida
- Housing Vacancy Rate by Zip Code (ZCTA5) — Florida
- Household Average Size by Zip Code (ZCTA5) — North Carolina
- Housing % of Units Built Since 2010, by Zip Code (ZCTA5) — Florida
- Household Average Size by Zip Code (ZCTA5) — Florida
- Housing Owner-Occupied % of Units, by Zip Code (ZCTA5) — Florida
- Housing Owner-Occupied Median Value ($), by Zip Code (ZCTA5) — Florida
- Housing Median Monthly Rent ($), by Zip Code (ZCTA5) — Florida
- Household Average Size by Zip Code (ZCTA5) — California
- % of Population without Health Insurance, by Zip Code (ZCTA5) — Florida
- Bachelor's Degree or Higher (% of Over 25) by Zip Code (ZCTA5) — Florida
- Bachelor's Degree or Higher (% of Over 25) by Zip Code (ZCTA5) — Mississippi
- High School Graduate (% of Over 25) by Zip Code (ZCTA5) — Mississippi
- % of Households with Broadband Internet, by Zip Code (ZCTA5) — Mississippi
- % of Population without Health Insurance, by Zip Code (ZCTA5) — Mississippi
- Population Non-Hispanic American Indian % by Zip Code (ZCTA5) — Mississippi
- Housing Median Monthly Rent ($), by Zip Code (ZCTA5) — Mississippi
- Median Age by Zip Code (ZCTA5) — Idaho
- Population Non-Hispanic White % by Zip Code (ZCTA5) — Arkansas
- Population Non-Hispanic White % by Zip Code (ZCTA5) — Texas
- Population Non-Hispanic White % by Zip Code (ZCTA5) — Ohio
- Population Non-Hispanic White % by Zip Code (ZCTA5) — Iowa
- Population Non-Hispanic White % by Zip Code (ZCTA5) — Utah
- Population Non-Hispanic White % by Zip Code (ZCTA5) — Nevada
- Population Non-Hispanic White % by Zip Code (ZCTA5) — Oregon
- Population Non-Hispanic White % by Zip Code (ZCTA5) — Idaho
- Population Non-Hispanic White % by Zip Code (ZCTA5) — Hawaii
- Population Non-Hispanic White % by Zip Code (ZCTA5) — Maine