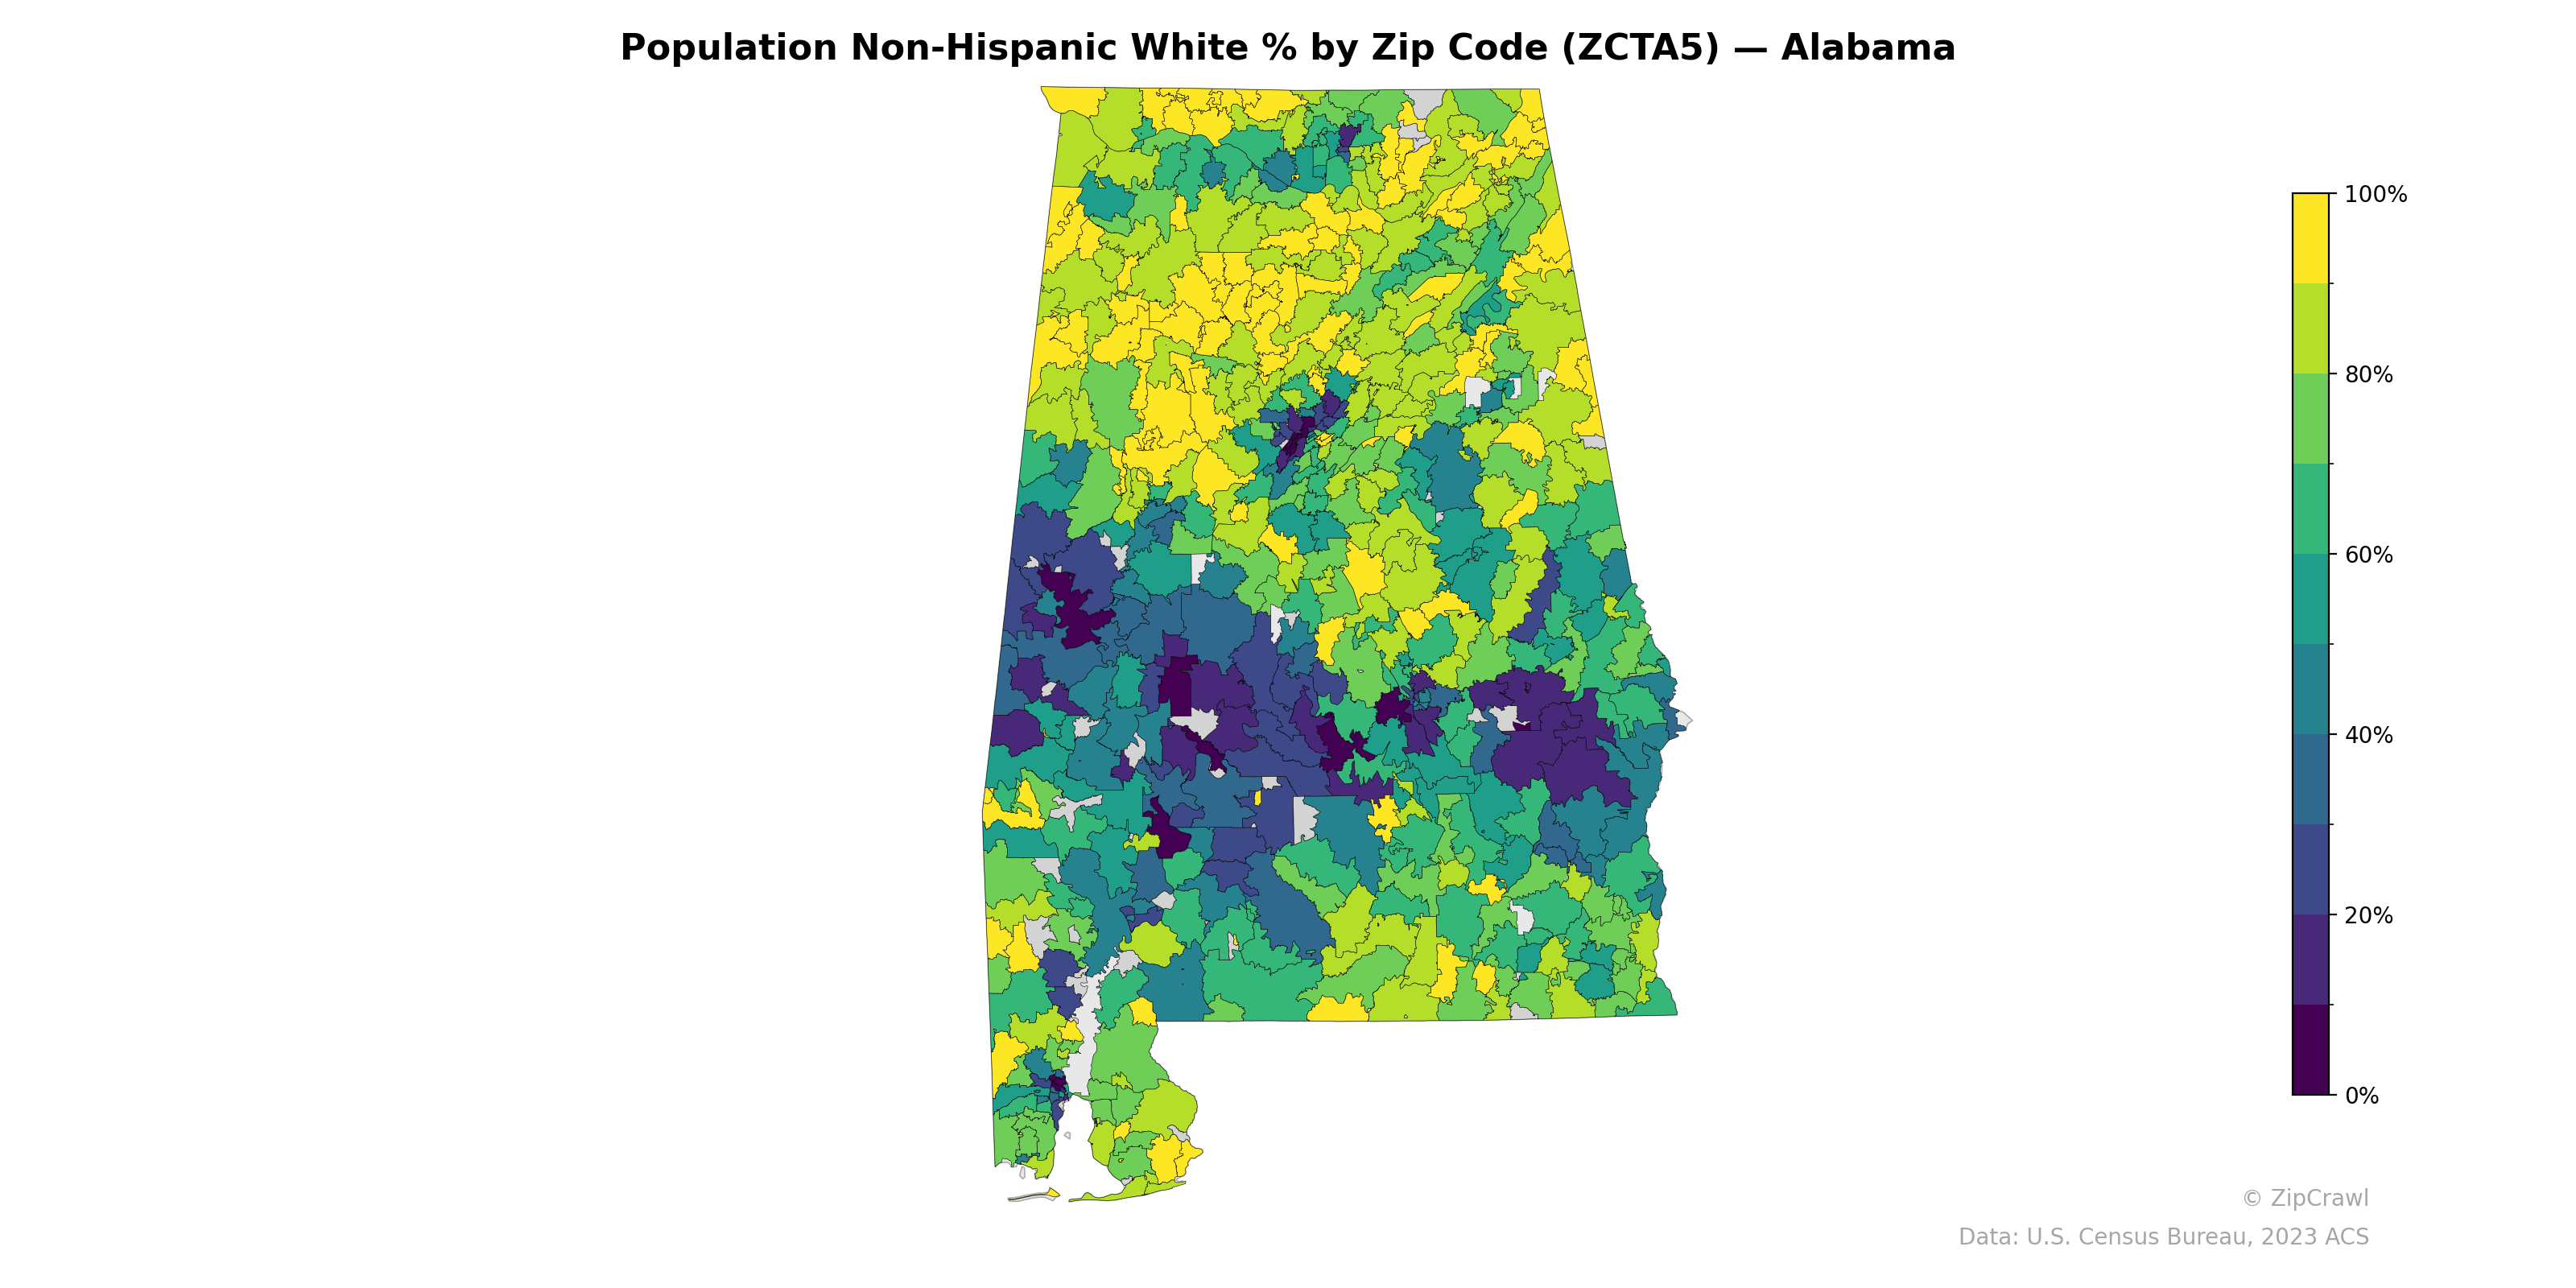
NOTE: Gray indicates insufficient data or a suppressed estimate.
Northern Alabama zip codes, particularly in the northeastern and northwestern corners of the state, display consistently high non-Hispanic white population shares exceeding 80%, while a pronounced corridor of low percentages (under 20%) stretches through the central Black Belt region from west-central Alabama toward the southeast, reflecting the historically significant African American population concentration in that area. Urban centers such as Birmingham and Montgomery contain sharp intra-metropolitan contrasts, with adjacent zip codes ranging from below 10% to above 70% non-Hispanic white population. The southern coastal region around Mobile shows moderate diversity with a patchwork of mid-range values, distinct from both the predominantly white northern zones and the majority-minority Black Belt.
Data: U.S. Census Bureau, 2023 ACS
Explore
- Household Average Size by Zip Code (ZCTA5) — Texas
- Housing Vacancy Rate by Zip Code (ZCTA5) — Texas
- Household Median Income by Zip Code (ZCTA5) — Alabama
- Population Non-Hispanic Black % by Zip Code (ZCTA5) — Alabama
- U.S. Citizens (% of Population Over 18) by Zip Code (ZCTA5) — Alabama
- Median Age by Zip Code (ZCTA5) — Alabama
- Population Hispanic % by Zip Code (ZCTA5) — Alabama
- Bachelor's Degree or Higher (% of Over 25) by County
- Housing Median Monthly Rent ($), by Zip Code (ZCTA5) — Texas
- Housing Owner-Occupied Median Value ($), by Zip Code (ZCTA5) — Texas
- Housing Owner-Occupied % of Units, by Zip Code (ZCTA5) — Texas
- Bachelor's Degree or Higher (% of Over 25) by Zip Code (ZCTA5) — Texas
- Married Couple (% of all Households) by Zip Code (ZCTA5) — Texas
- Housing % of Units Built Since 2010, by Zip Code (ZCTA5) — Texas
- % of Households with Broadband Internet, by Zip Code (ZCTA5) — Texas
- % of Population without Health Insurance, by Zip Code (ZCTA5) — Texas
- % of Households with Broadband Internet, by Zip Code (ZCTA5) — Wisconsin
- Bachelor's Degree or Higher (% of Over 25) by Zip Code (ZCTA5) — Wisconsin
- % of Population on Food Stamps or SNAP (Last 12 Months), by Zip Code (ZCTA5) — Wisconsin
- Population Non-Hispanic American Indian % by Zip Code (ZCTA5) — Wisconsin
- Population Non-Hispanic Black % by Zip Code (ZCTA5) — Wisconsin
- U.S. Citizens (% of Population Over 18) by Zip Code (ZCTA5) — Colorado
- Married Couple (% of all Households) by Zip Code (ZCTA5) — Wisconsin
- Median Age by Zip Code (ZCTA5) — Wisconsin
- Housing Vacancy Rate by Zip Code (ZCTA5) — Wisconsin
- High School Graduate (% of Over 25) by Zip Code (ZCTA5) — Wisconsin
- Population Hispanic % by Zip Code (ZCTA5) — Wisconsin
- Household Average Size by Zip Code (ZCTA5) — Wisconsin
- Population Non-Hispanic Asian % by Zip Code (ZCTA5) — Wisconsin
- Housing Owner-Occupied Median Value ($), by Zip Code (ZCTA5) — Wisconsin
- Population Non-Hispanic White % by Zip Code (ZCTA5) — Alaska
- Population Non-Hispanic White % by Zip Code (ZCTA5) — Iowa
- Population Non-Hispanic White % by Zip Code (ZCTA5) — Ohio
- Population Non-Hispanic White % by Zip Code (ZCTA5) — Utah
- Population Non-Hispanic White % by Zip Code (ZCTA5) — Arizona
- Population Non-Hispanic White % by Zip Code (ZCTA5) — Oregon
- Population Non-Hispanic White % by Zip Code (ZCTA5) — Nevada
- Population Non-Hispanic White % by Zip Code (ZCTA5) — Texas
- Population Non-Hispanic White % by Zip Code (ZCTA5) — Idaho
- Population Non-Hispanic White % by Zip Code (ZCTA5) — Hawaii