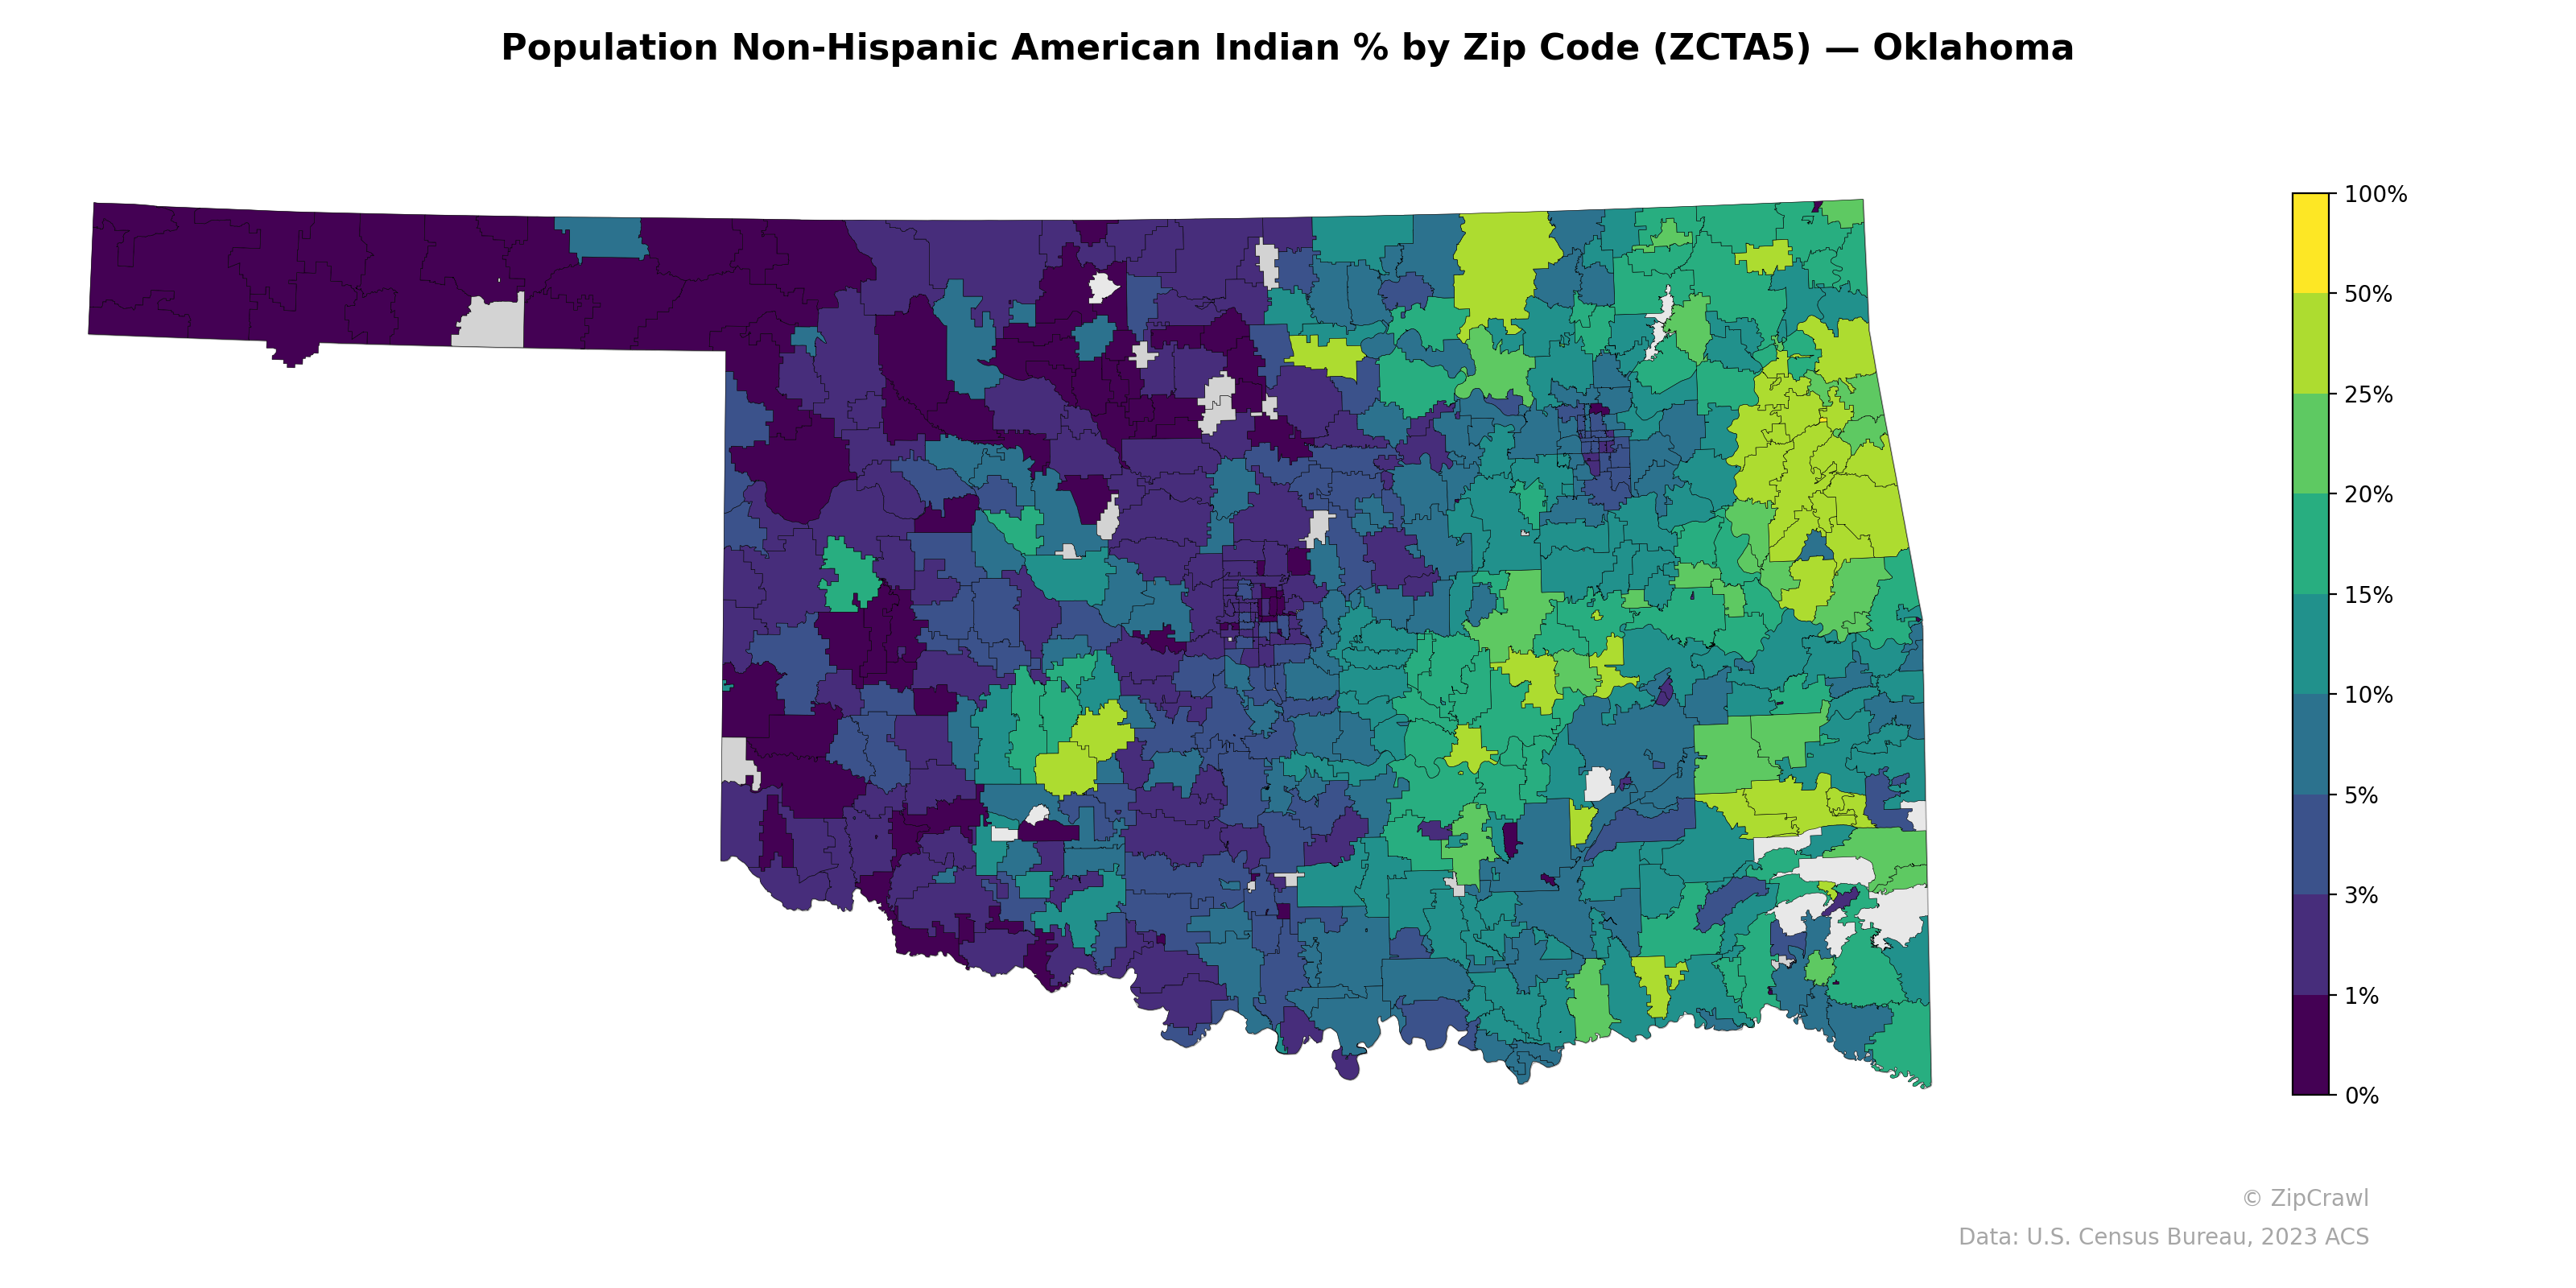
NOTE: Gray indicates insufficient data or a suppressed estimate.
Eastern Oklahoma exhibits markedly higher Non-Hispanic American Indian population concentrations, with numerous zip codes in the 15–50% range and several exceeding 50%, reflecting the historical boundaries of Indian Territory and the concentration of tribal nations such as the Cherokee, Choctaw, and Creek. The western half of the state, particularly the Panhandle and southwestern counties, shows consistently low percentages at or below 3%, creating a stark east-west demographic divide. Notable clusters of elevated percentages also appear in south-central Oklahoma around areas associated with the Chickasaw and Choctaw nations, while urban cores like Oklahoma City display lower concentrations compared to their surrounding rural and suburban zip codes.
Data: U.S. Census Bureau, 2023 ACS
Explore
- Married Couple (% of all Households) by Zip Code (ZCTA5) — California
- Population Non-Hispanic Asian % by Zip Code (ZCTA5) — Illinois
- % of Population without Health Insurance, by Zip Code (ZCTA5) — Oklahoma
- Housing Owner-Occupied Median Value ($), by Zip Code (ZCTA5) — Oklahoma
- % of Households with Broadband Internet, by Zip Code (ZCTA5) — Oklahoma
- High School Graduate (% of Over 25) by Zip Code (ZCTA5) — Oklahoma
- Housing Owner-Occupied % of Units, by Zip Code (ZCTA5) — Oklahoma
- Bachelor's Degree or Higher (% of Over 25) by Zip Code (ZCTA5) — Oklahoma
- Housing % of Units Built Since 2010, by Zip Code (ZCTA5) — Oklahoma
- Housing Median Monthly Rent ($), by Zip Code (ZCTA5) — Oklahoma
- Household Average Size by Zip Code (ZCTA5) — Oklahoma
- Housing Owner-Occupied % of Units, by County
- Housing Median Monthly Rent ($), by Zip Code (ZCTA5) — California
- Housing Owner-Occupied Median Value ($), by Zip Code (ZCTA5) — California
- Housing % of Units Built Since 2010, by Zip Code (ZCTA5) — California
- % of Population without Health Insurance, by Zip Code (ZCTA5) — California
- Housing Owner-Occupied % of Units, by Zip Code (ZCTA5) — California
- Bachelor's Degree or Higher (% of Over 25) by Zip Code (ZCTA5) — California
- % of Households with Broadband Internet, by Zip Code (ZCTA5) — California
- Housing Vacancy Rate by Zip Code (ZCTA5) — California
- Household Average Size by Zip Code (ZCTA5) — California
- Housing % of Units Built Since 2010, by Zip Code (ZCTA5) — Oregon
- Household Average Size by Zip Code (ZCTA5) — Oregon
- Population Non-Hispanic Black % by Zip Code (ZCTA5) — Oregon
- Population Non-Hispanic White % by Zip Code (ZCTA5) — Oregon
- Housing Owner-Occupied Median Value ($), by Zip Code (ZCTA5) — Oregon
- Population Hispanic % by Zip Code (ZCTA5) — Oregon
- Housing Median Monthly Rent ($), by Zip Code (ZCTA5) — Oregon
- Married Couple (% of all Households) by Zip Code (ZCTA5) — Oregon
- U.S. Citizens (% of Population Over 18) by Zip Code (ZCTA5) — Oregon
- Population Non-Hispanic American Indian % by Zip Code (ZCTA5) — Indiana
- Population Non-Hispanic American Indian % by Zip Code (ZCTA5) — Idaho
- Population Non-Hispanic American Indian % by Zip Code (ZCTA5) — Ohio
- Population Non-Hispanic American Indian % by Zip Code (ZCTA5) — Oregon
- Population Non-Hispanic American Indian % by Zip Code (ZCTA5) — Iowa
- Population Non-Hispanic American Indian % by Zip Code (ZCTA5) — Alabama
- Population Non-Hispanic American Indian % by Zip Code (ZCTA5) — Utah
- Population Non-Hispanic American Indian % by Zip Code (ZCTA5) — Nevada
- Population Non-Hispanic American Indian % by Zip Code (ZCTA5) — Texas
- Population Non-Hispanic American Indian % by Zip Code (ZCTA5) — Hawaii