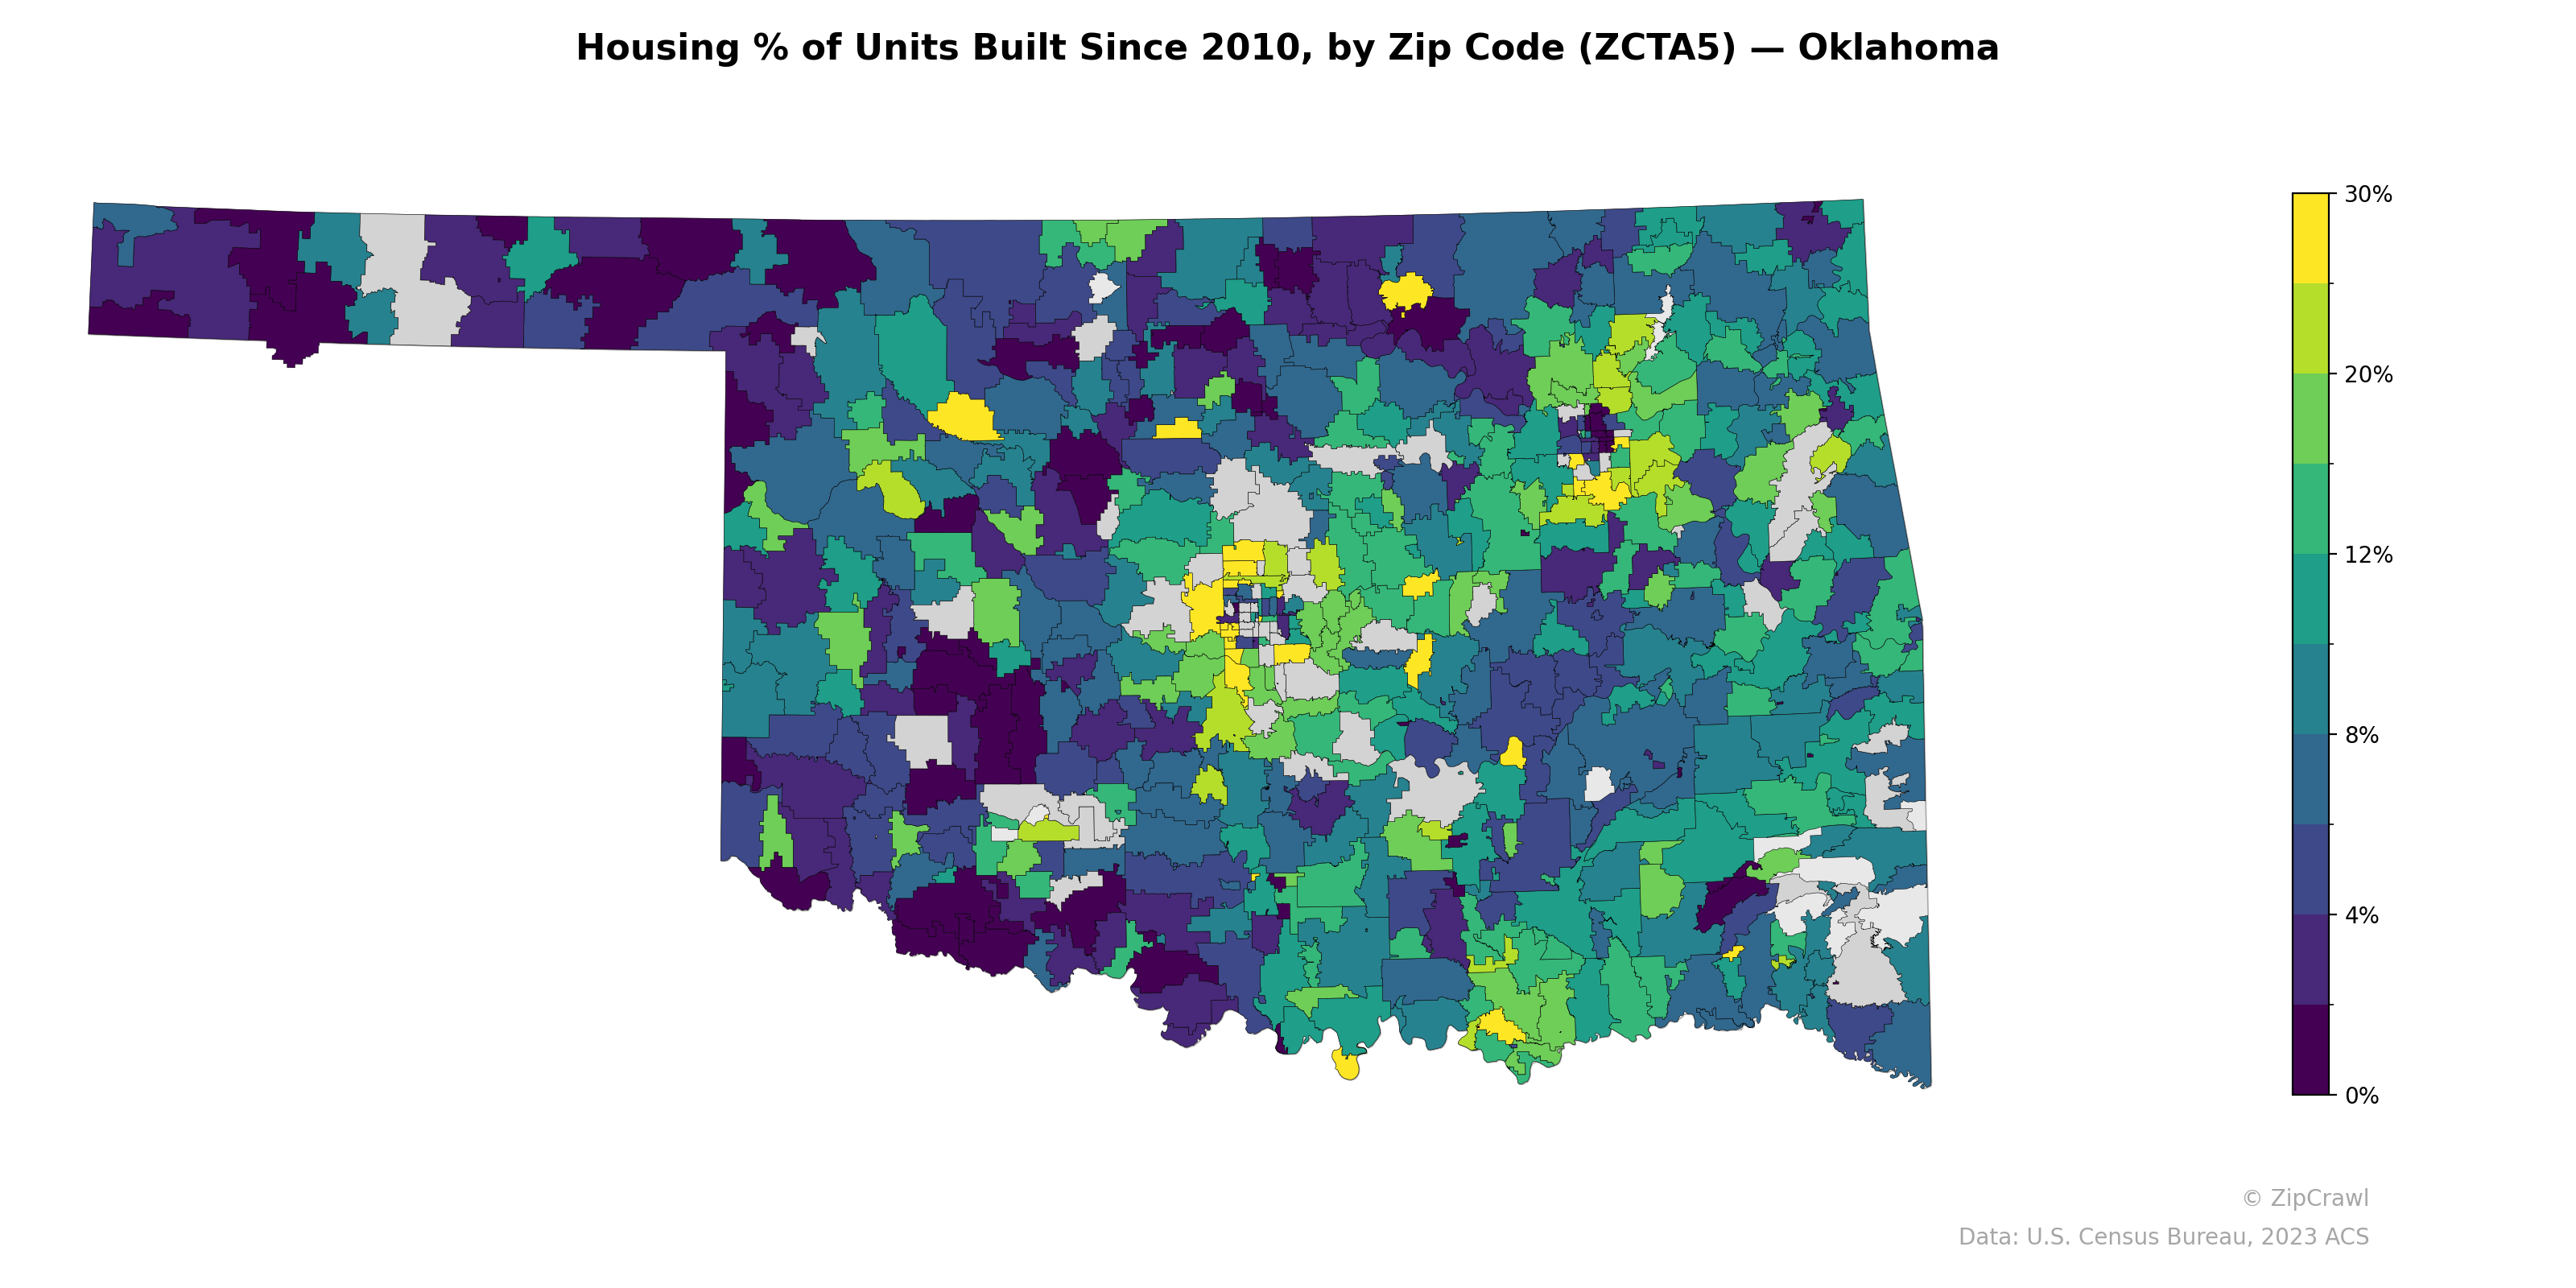
NOTE: Gray indicates insufficient data or a suppressed estimate.
The Oklahoma City metropolitan area displays the highest concentration of post-2010 housing construction, with several zip codes in the central cluster reaching 20–30%, likely reflecting suburban growth in areas such as Edmond, Yukon, and south Oklahoma City. The northwestern Panhandle region and parts of the Tulsa metro area also exhibit moderate new-build activity (8–12%), while large swaths of southwestern and southeastern Oklahoma remain at or near 0%, indicating minimal residential development over the past decade. A notable contrast exists between the urban corridors along the I-35 and I-44 axes, which attracted significant new construction, and the rural periphery where housing stock is aging with little replenishment.
Data: U.S. Census Bureau, 2023 ACS
Explore
- Married Couple (% of all Households) by Zip Code (ZCTA5) — California
- Population Non-Hispanic American Indian % by Zip Code (ZCTA5) — Pennsylvania
- Population Non-Hispanic American Indian % by Zip Code (ZCTA5) — Oklahoma
- Housing Owner-Occupied Median Value ($), by Zip Code (ZCTA5) — Oklahoma
- Household Average Size by Zip Code (ZCTA5) — Oklahoma
- Housing Median Monthly Rent ($), by Zip Code (ZCTA5) — Oklahoma
- Bachelor's Degree or Higher (% of Over 25) by Zip Code (ZCTA5) — Oklahoma
- % of Population without Health Insurance, by Zip Code (ZCTA5) — Oklahoma
- Housing Owner-Occupied % of Units, by Zip Code (ZCTA5) — Oklahoma
- % of Households with Broadband Internet, by Zip Code (ZCTA5) — Oklahoma
- High School Graduate (% of Over 25) by Zip Code (ZCTA5) — Oklahoma
- Housing Owner-Occupied % of Units, by County
- Housing Owner-Occupied Median Value ($), by Zip Code (ZCTA5) — California
- % of Population without Health Insurance, by Zip Code (ZCTA5) — California
- Bachelor's Degree or Higher (% of Over 25) by Zip Code (ZCTA5) — California
- Housing Median Monthly Rent ($), by Zip Code (ZCTA5) — California
- % of Households with Broadband Internet, by Zip Code (ZCTA5) — California
- Household Average Size by Zip Code (ZCTA5) — California
- Housing Vacancy Rate by Zip Code (ZCTA5) — California
- Housing Owner-Occupied % of Units, by Zip Code (ZCTA5) — California
- Household Average Size by Zip Code (ZCTA5) — Oregon
- Married Couple (% of all Households) by Zip Code (ZCTA5) — Oregon
- Population Non-Hispanic Black % by Zip Code (ZCTA5) — Oregon
- High School Graduate (% of Over 25) by Zip Code (ZCTA5) — Oregon
- Population Non-Hispanic American Indian % by Zip Code (ZCTA5) — Oregon
- Population Hispanic % by Zip Code (ZCTA5) — Oregon
- Housing Median Monthly Rent ($), by Zip Code (ZCTA5) — Oregon
- Housing Vacancy Rate by Zip Code (ZCTA5) — Oregon
- Household Median Income by Zip Code (ZCTA5) — Oregon
- U.S. Citizens (% of Population Over 18) by Zip Code (ZCTA5) — Oregon
- Housing % of Units Built Since 2010, by Zip Code (ZCTA5) — Idaho
- Housing % of Units Built Since 2010, by Zip Code (ZCTA5) — Ohio
- Housing % of Units Built Since 2010, by Zip Code (ZCTA5) — Utah
- Housing % of Units Built Since 2010, by Zip Code (ZCTA5) — Iowa
- Housing % of Units Built Since 2010, by Zip Code (ZCTA5) — Alabama
- Housing % of Units Built Since 2010, by Zip Code (ZCTA5) — Maine
- Housing % of Units Built Since 2010, by Zip Code (ZCTA5) — Oregon
- Housing % of Units Built Since 2010, by Zip Code (ZCTA5) — Texas
- Housing % of Units Built Since 2010, by Zip Code (ZCTA5) — Hawaii
- Housing % of Units Built Since 2010, by Zip Code (ZCTA5) — Wyoming